 16
16peptides
spectra
0.000 | 0.000
0.000 | 0.000
0.000 | 0.000
0.000 | 0.000
0.207 | 0.213
0.000 | 0.000
0.786 | 0.793
0.000 | 0.000
| Plot | Mito | Lyso | Perox | ER | Golgi | PM | Cytosol | Nucleus | |||||
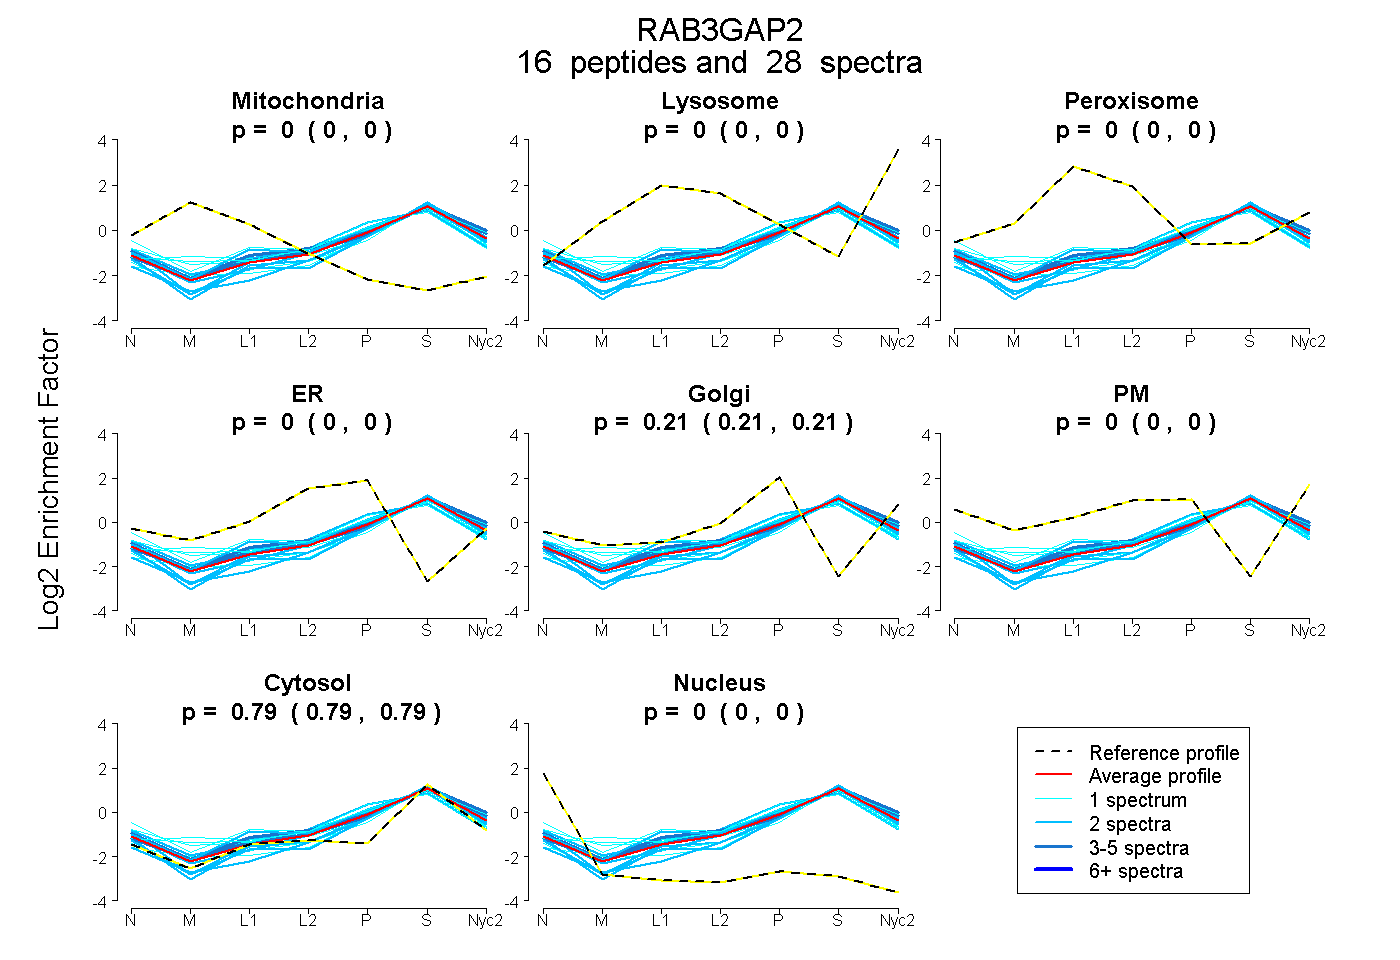
| Expt A |
16 peptides |
28 spectra |
|
0.000 0.000 | 0.000 |
0.000 0.000 | 0.000 |
0.000 0.000 | 0.000 |
0.000 0.000 | 0.000 |
0.210 0.207 | 0.213 |
0.000 0.000 | 0.000 |
0.790 0.786 | 0.793 |
0.000 0.000 | 0.000 |
| 2 spectra, QALESILASDR | 0.000 | 0.000 | 0.000 | 0.000 | 0.116 | 0.000 | 0.884 | 0.000 | ||
| 2 spectra, VILLDVAR | 0.000 | 0.000 | 0.000 | 0.000 | 0.117 | 0.000 | 0.883 | 0.000 | ||
| 1 spectrum, TFLEYLDYEK | 0.000 | 0.000 | 0.028 | 0.153 | 0.144 | 0.000 | 0.676 | 0.000 | ||
| 2 spectra, VMELLPEK | 0.000 | 0.000 | 0.042 | 0.000 | 0.222 | 0.000 | 0.735 | 0.000 | ||
| 3 spectra, MEPATPLAVR | 0.000 | 0.053 | 0.000 | 0.000 | 0.168 | 0.000 | 0.779 | 0.000 | ||
| 3 spectra, SPRPDSFEAEIK | 0.000 | 0.054 | 0.000 | 0.000 | 0.200 | 0.000 | 0.745 | 0.000 | ||
| 2 spectra, AAFLVPK | 0.000 | 0.000 | 0.000 | 0.000 | 0.148 | 0.000 | 0.852 | 0.000 | ||
| 1 spectrum, VVSAAVQAQHSK | 0.000 | 0.072 | 0.000 | 0.000 | 0.233 | 0.000 | 0.695 | 0.000 | ||
| 2 spectra, LPPTLCTWLK | 0.000 | 0.000 | 0.000 | 0.077 | 0.211 | 0.000 | 0.712 | 0.000 | ||
| 2 spectra, DLHLVK | 0.000 | 0.068 | 0.000 | 0.000 | 0.157 | 0.000 | 0.775 | 0.000 | ||
| 1 spectrum, EVLASQLLVLTGQR | 0.000 | 0.000 | 0.000 | 0.000 | 0.134 | 0.000 | 0.866 | 0.000 | ||
| 1 spectrum, GDFSPFGNTQGPSR | 0.000 | 0.000 | 0.000 | 0.000 | 0.102 | 0.000 | 0.898 | 0.000 | ||
| 1 spectrum, QLEDCLILQTLLHSR | 0.000 | 0.000 | 0.004 | 0.097 | 0.174 | 0.000 | 0.725 | 0.000 | ||
| 2 spectra, LAHALFHTQTK | 0.000 | 0.000 | 0.000 | 0.000 | 0.225 | 0.000 | 0.775 | 0.000 | ||
| 2 spectra, ASSPQTEPLPR | 0.000 | 0.000 | 0.000 | 0.000 | 0.192 | 0.000 | 0.808 | 0.000 | ||
| 1 spectrum, FSEDADGVLPVK | 0.057 | 0.022 | 0.024 | 0.000 | 0.151 | 0.000 | 0.747 | 0.000 |
| Plot | Mito | Lyso or Perox | ER | Golgi | PM | Cytosol | Nucleus | ||||||
| Expt B |
3 peptides |
4 spectra |
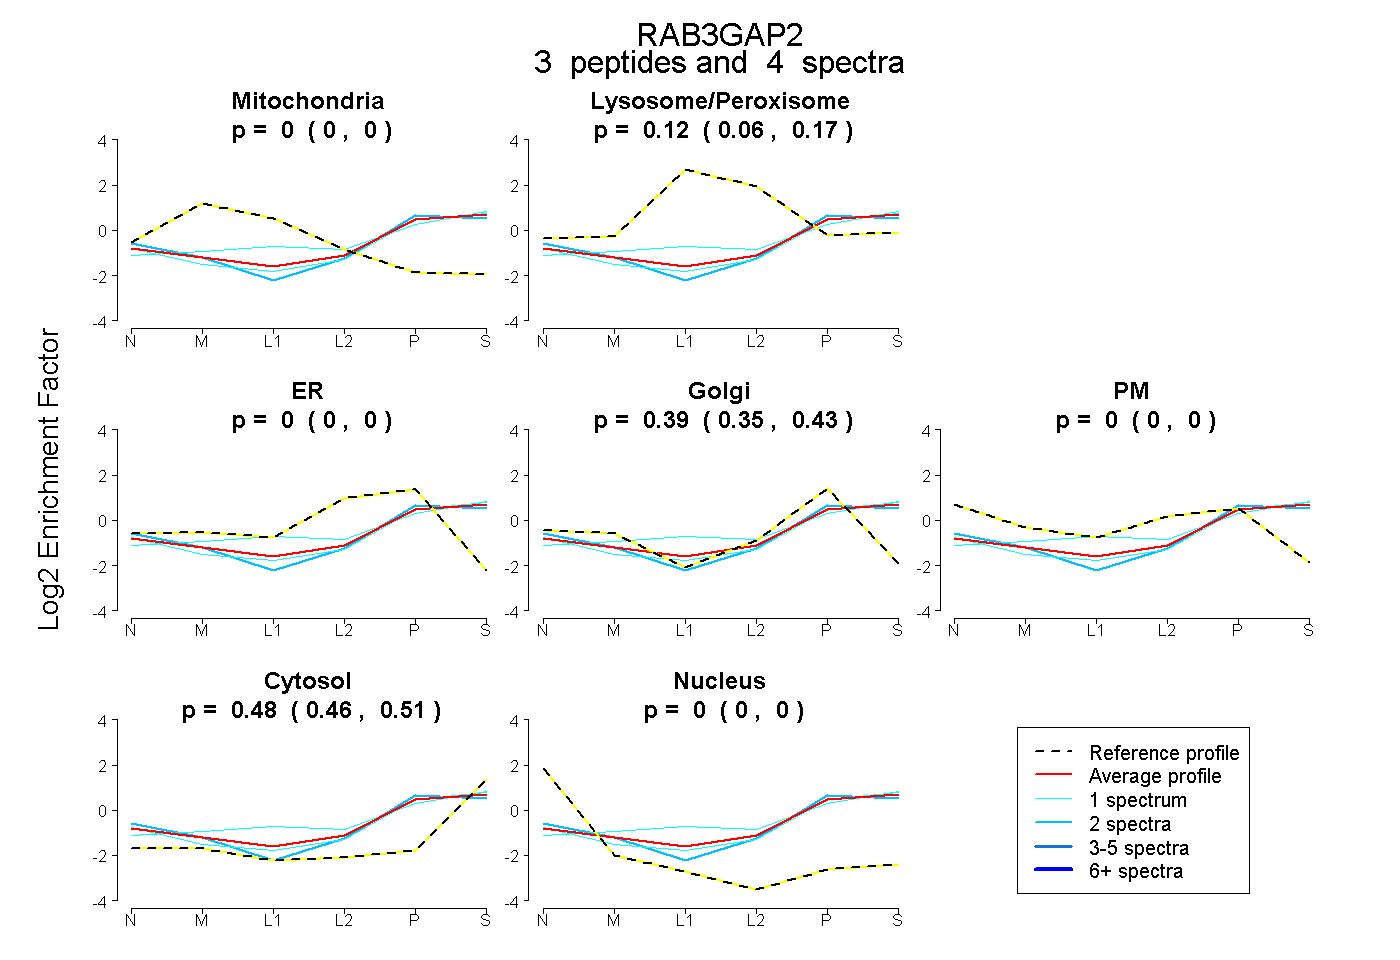 |
0.000 0.000 | 0.000 |
0.121 0.062 | 0.169 |
0.000 0.000 | 0.000 |
0.394 0.351 | 0.432 |
0.000 0.000 | 0.000 |
0.485 0.456 | 0.507 |
0.000 0.000 | 0.000 |
|||
| Plot | Lyso | Other | |||||||||||
| Expt C |
11 peptides |
24 spectra |
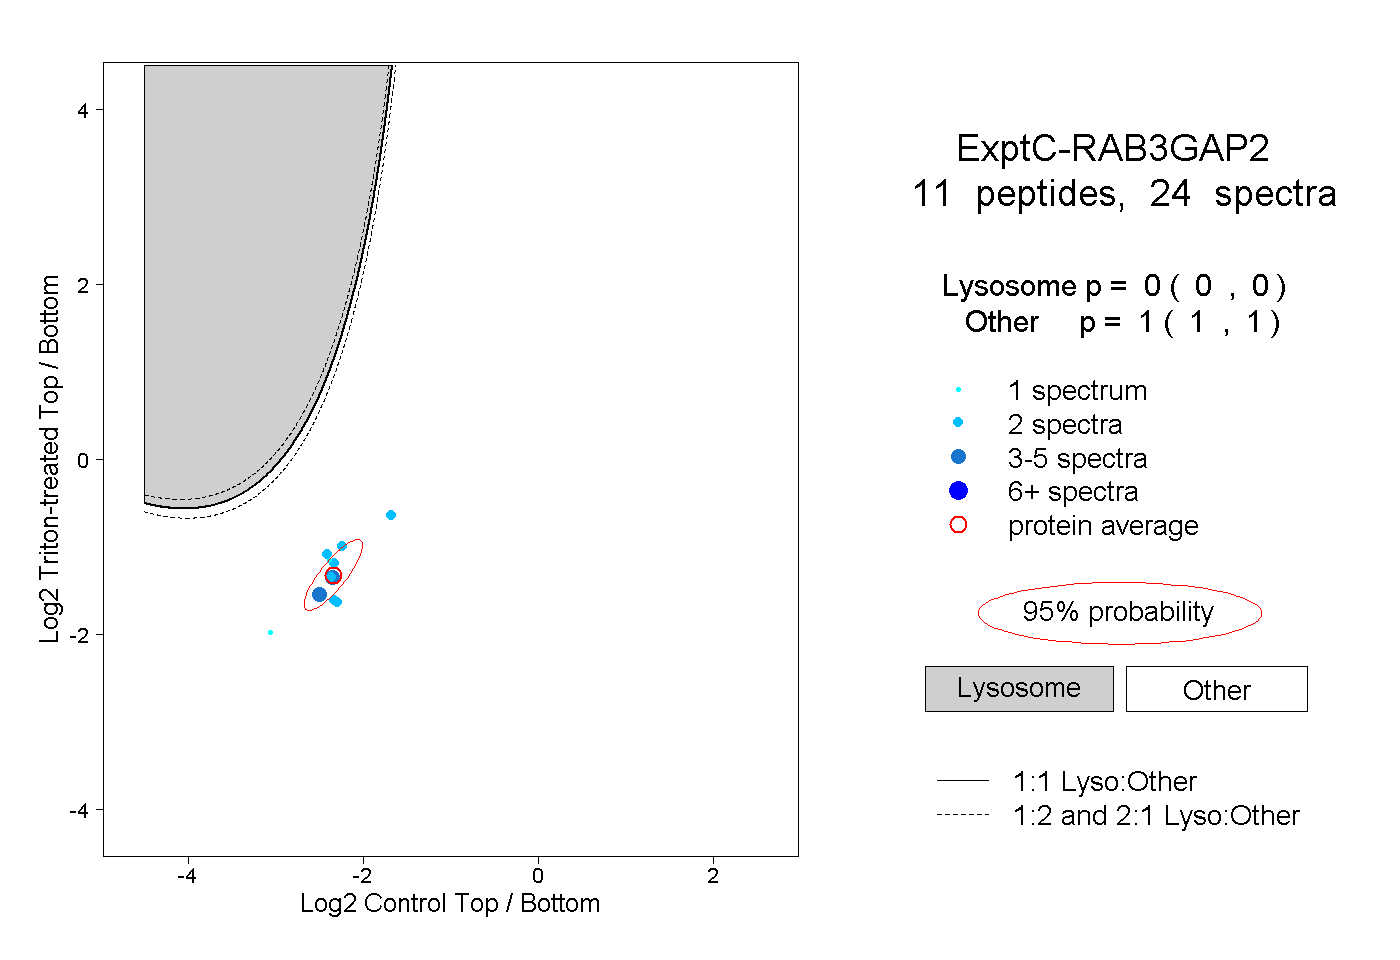 |
0.000 0.000 | 0.000 |
1.000 1.000 | 1.000 |