 14
14peptides
spectra
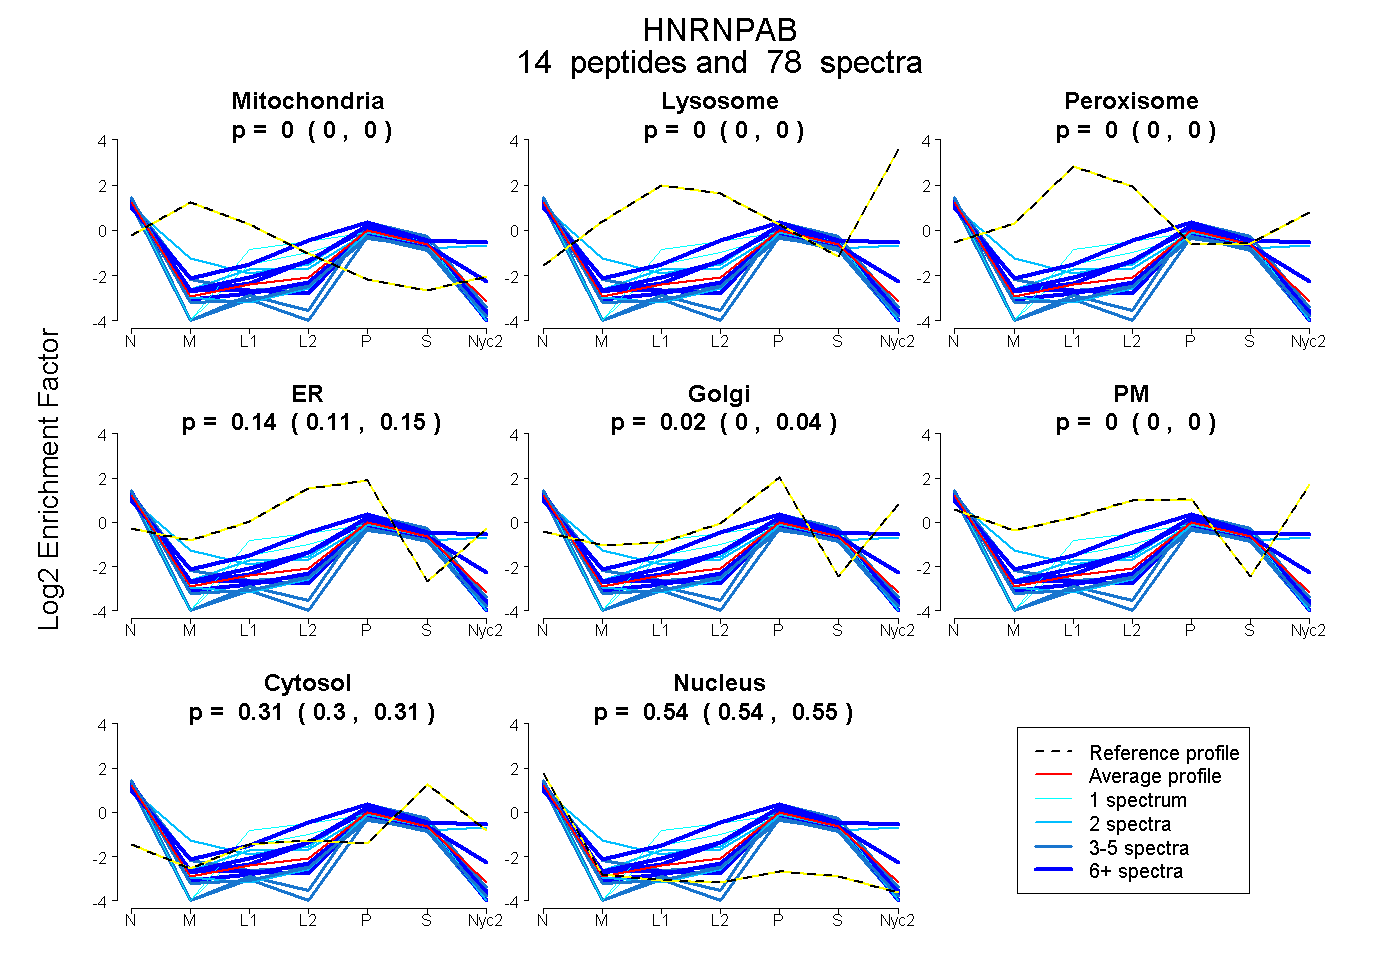
0.000 | 0.000
0.000 | 0.000
0.000 | 0.000
0.107 | 0.152
0.000 | 0.042
0.000 | 0.000
0.303 | 0.309
0.535 | 0.547
4peptides
spectra
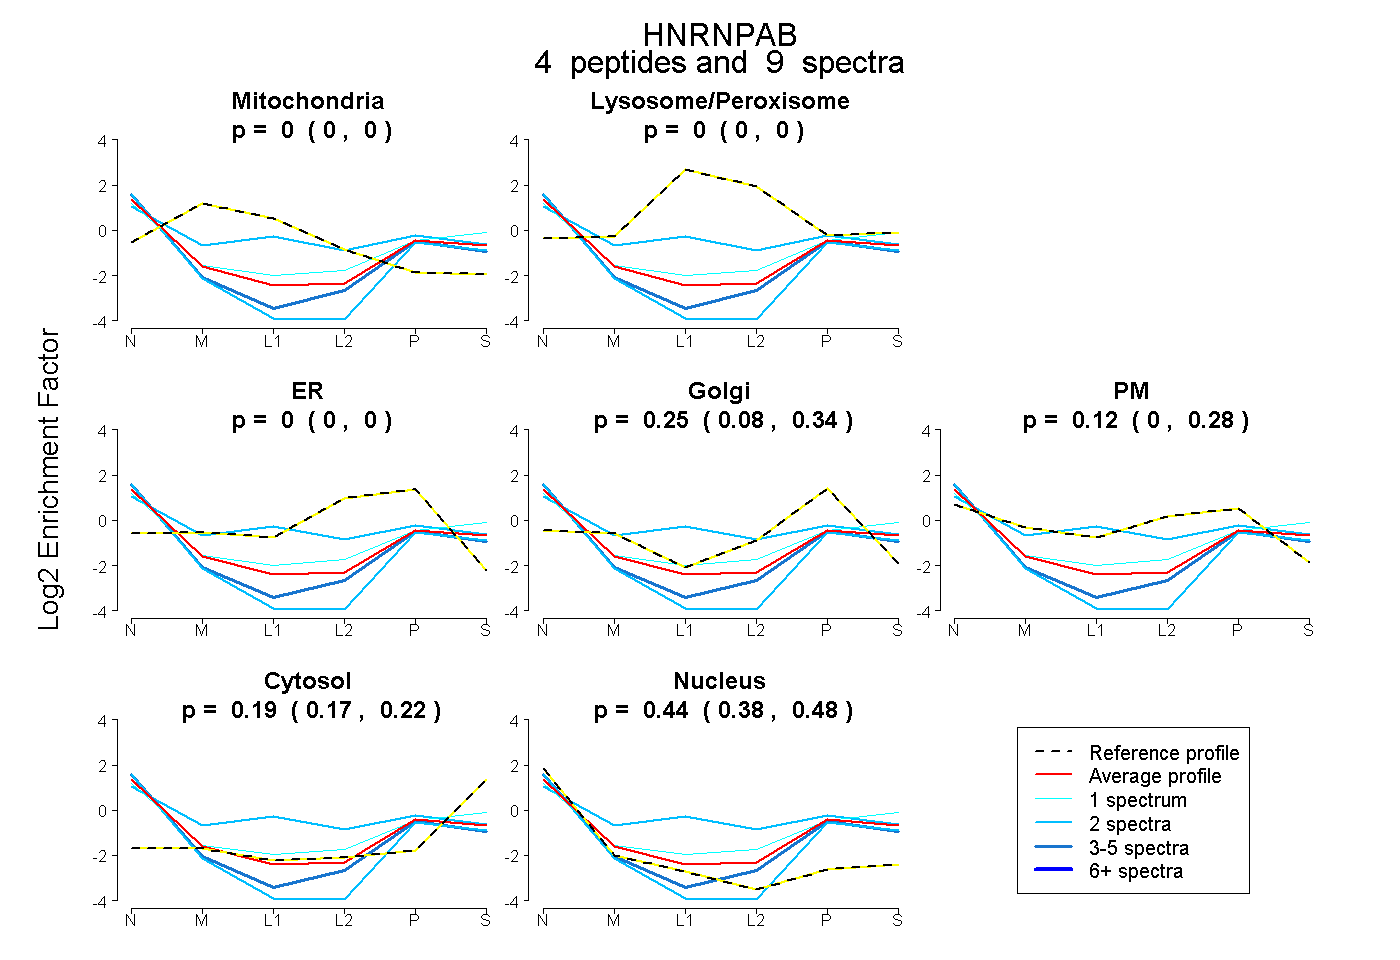
0.000 | 0.000
0.000 | 0.000
0.000 | 0.000
0.076 | 0.343
0.000 | 0.283
0.167 | 0.219
0.383 | 0.485
3peptides
spectra
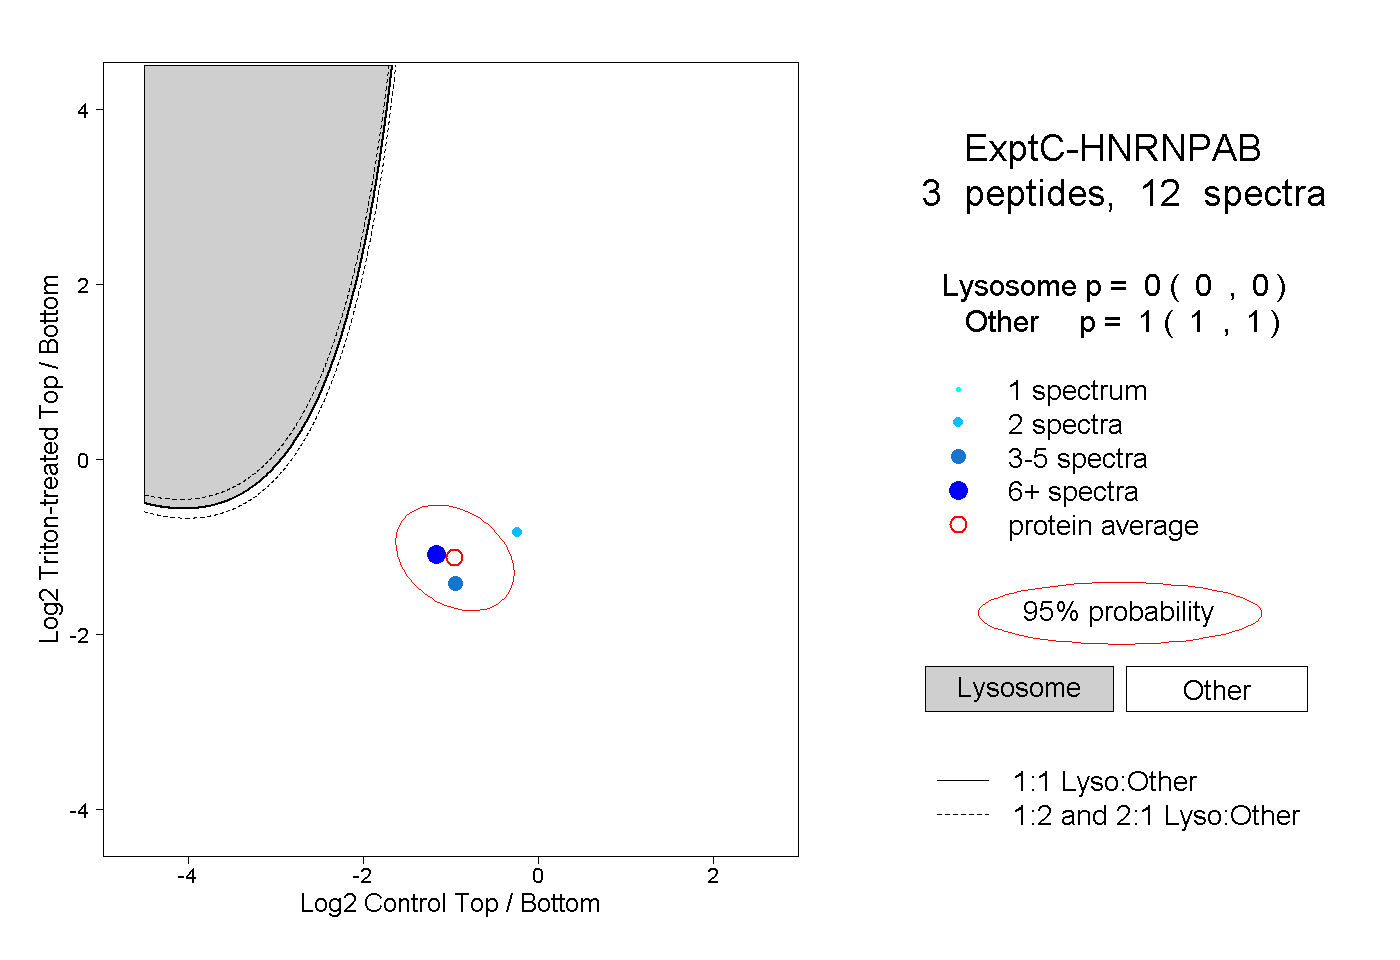
0.000 | 0.000
1.000 | 1.000
3peptides
spectra
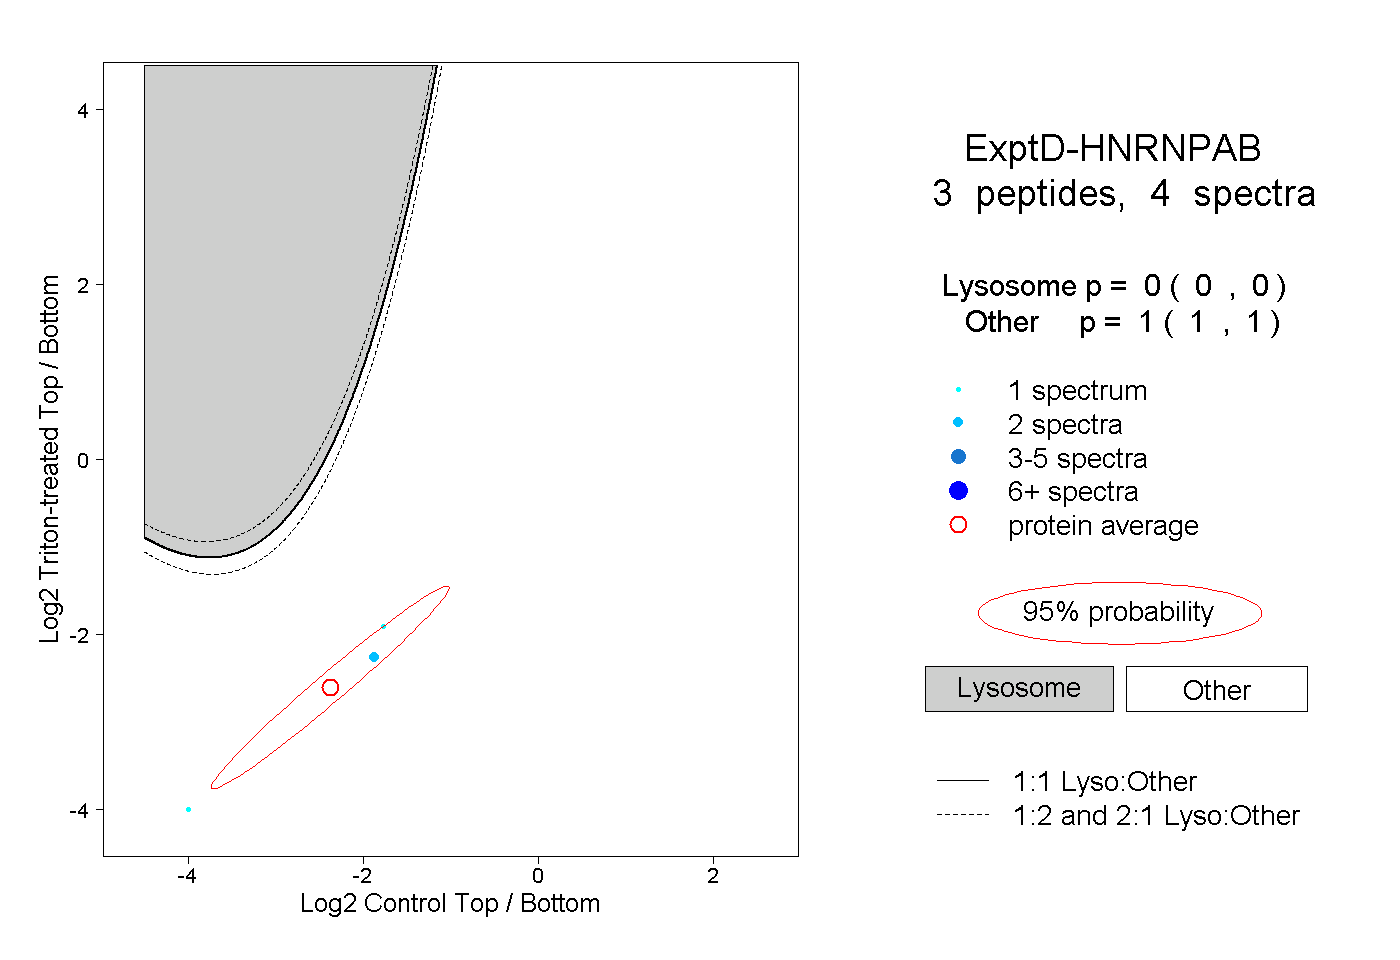
0.000 | 0.000
1.000 | 1.000