 14
14peptides
spectra
0.000 | 0.000
0.000 | 0.000
0.000 | 0.000
0.107 | 0.152
0.000 | 0.042
0.000 | 0.000
0.303 | 0.309
0.535 | 0.547
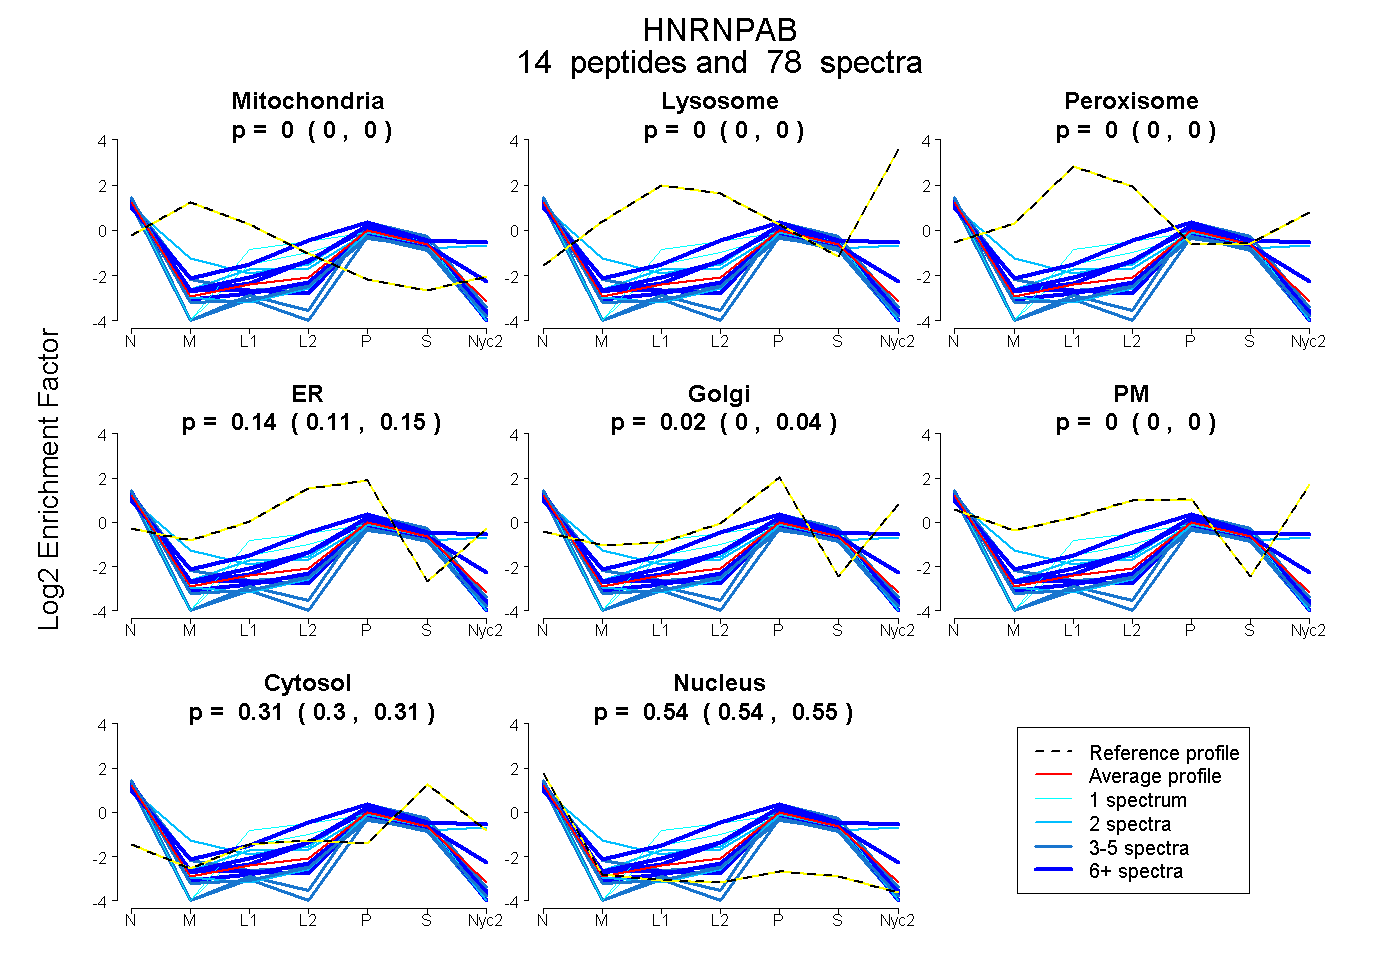
| Plot | Mito | Lyso | Perox | ER | Golgi | PM | Cytosol | Nucleus | |||||
| Expt A |
14 peptides |
78 spectra |
|
0.000 0.000 | 0.000 |
0.000 0.000 | 0.000 |
0.000 0.000 | 0.000 |
0.135 0.107 | 0.152 |
0.016 0.000 | 0.042 |
0.000 0.000 | 0.000 |
0.307 0.303 | 0.309 |
0.542 0.535 | 0.547 |
| 5 spectra, FGEVVDCTIK | 0.000 | 0.000 | 0.000 | 0.103 | 0.000 | 0.000 | 0.266 | 0.632 | ||
| 6 spectra, MDQPSGR | 0.000 | 0.000 | 0.000 | 0.054 | 0.158 | 0.246 | 0.358 | 0.183 | ||
| 8 spectra, FHTVSGSK | 0.000 | 0.000 | 0.000 | 0.000 | 0.099 | 0.000 | 0.288 | 0.613 | ||
| 4 spectra, EVYQQQQYGSGGR | 0.000 | 0.000 | 0.000 | 0.000 | 0.000 | 0.000 | 0.219 | 0.781 | ||
| 2 spectra, DSSSVEK | 0.000 | 0.000 | 0.000 | 0.000 | 0.239 | 0.125 | 0.305 | 0.331 | ||
| 2 spectra, AMAMK | 0.000 | 0.000 | 0.000 | 0.302 | 0.000 | 0.000 | 0.247 | 0.451 | ||
| 20 spectra, MDPNTGR | 0.000 | 0.000 | 0.000 | 0.185 | 0.098 | 0.000 | 0.305 | 0.412 | ||
| 6 spectra, GFVFITFK | 0.000 | 0.000 | 0.000 | 0.197 | 0.000 | 0.000 | 0.261 | 0.542 | ||
| 1 spectrum, IFVGGLNPEATEEK | 0.000 | 0.000 | 0.000 | 0.248 | 0.000 | 0.000 | 0.304 | 0.448 | ||
| 5 spectra, GSGGGQGSTNYGK | 0.000 | 0.000 | 0.000 | 0.000 | 0.017 | 0.000 | 0.370 | 0.612 | ||
| 1 spectrum, EEDPVK | 0.000 | 0.000 | 0.000 | 0.165 | 0.000 | 0.000 | 0.326 | 0.509 | ||
| 2 spectra, MFVGGLSWDTSK | 0.000 | 0.000 | 0.000 | 0.036 | 0.015 | 0.000 | 0.280 | 0.669 | ||
| 13 spectra, GFGFILFK | 0.000 | 0.000 | 0.000 | 0.094 | 0.000 | 0.000 | 0.272 | 0.634 | ||
| 3 spectra, NEEDAGK | 0.000 | 0.000 | 0.000 | 0.045 | 0.011 | 0.000 | 0.263 | 0.681 |
| Plot | Mito | Lyso or Perox | ER | Golgi | PM | Cytosol | Nucleus | ||||||
| Expt B |
4 peptides |
9 spectra |
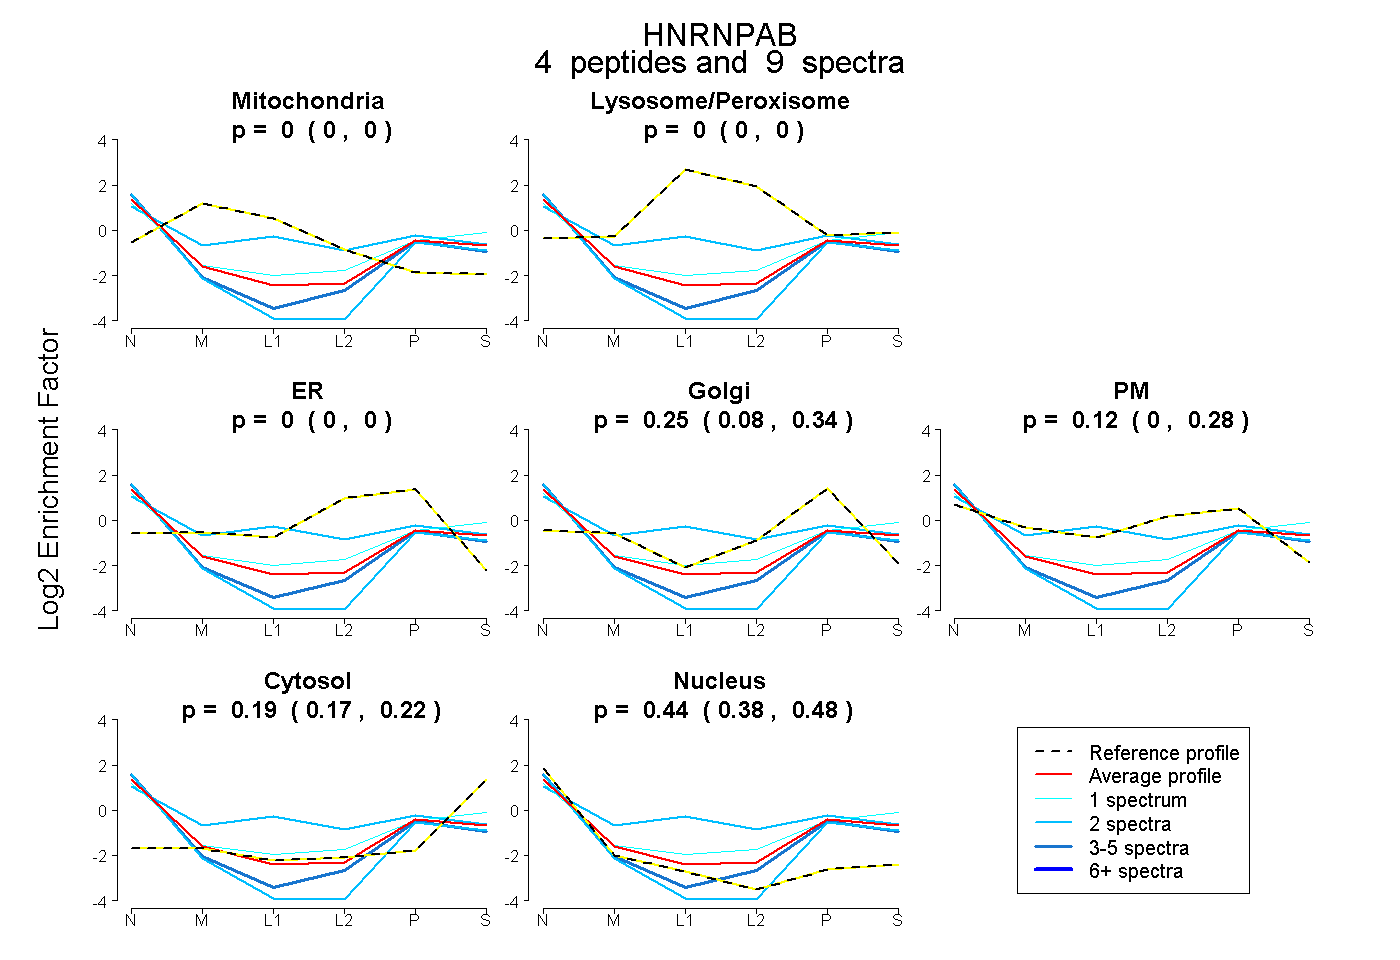 |
0.000 0.000 | 0.000 |
0.000 0.000 | 0.000 |
0.000 0.000 | 0.000 |
0.246 0.076 | 0.343 |
0.120 0.000 | 0.283 |
0.195 0.167 | 0.219 |
0.440 0.383 | 0.485 |
|||
| Plot | Lyso | Other | |||||||||||
| Expt C |
3 peptides |
12 spectra |
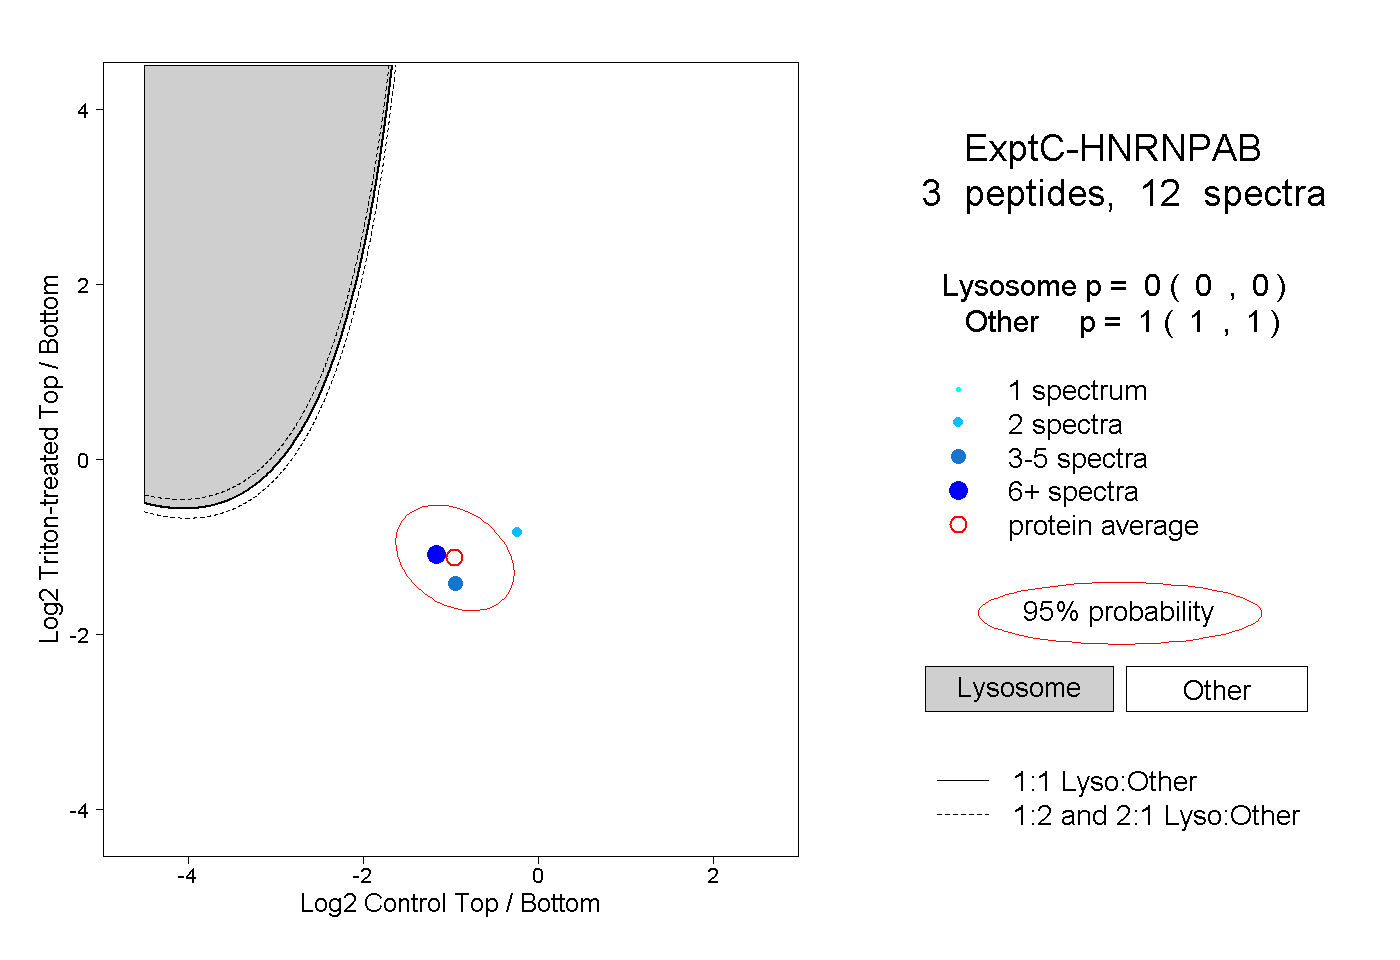 |
0.000 0.000 | 0.000 |
1.000 1.000 | 1.000 |
||||||||
| Plot | Lyso | Other | |||||||||||
| Expt D |
3 peptides |
4 spectra |
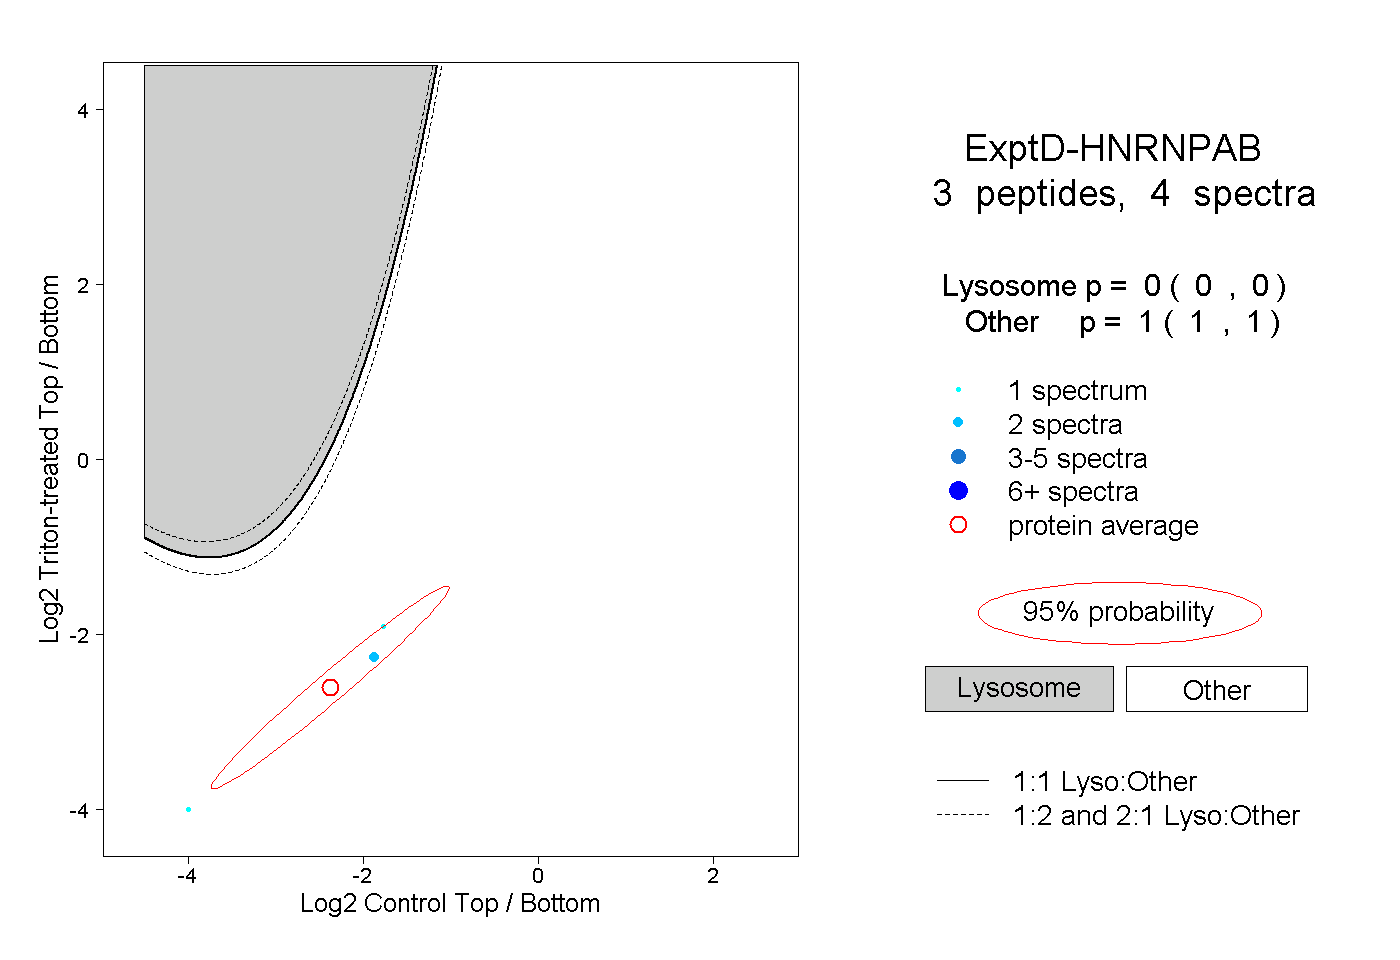 |
0.000 0.000 | 0.000 |
1.000 1.000 | 1.000 |