 14
14peptides
spectra
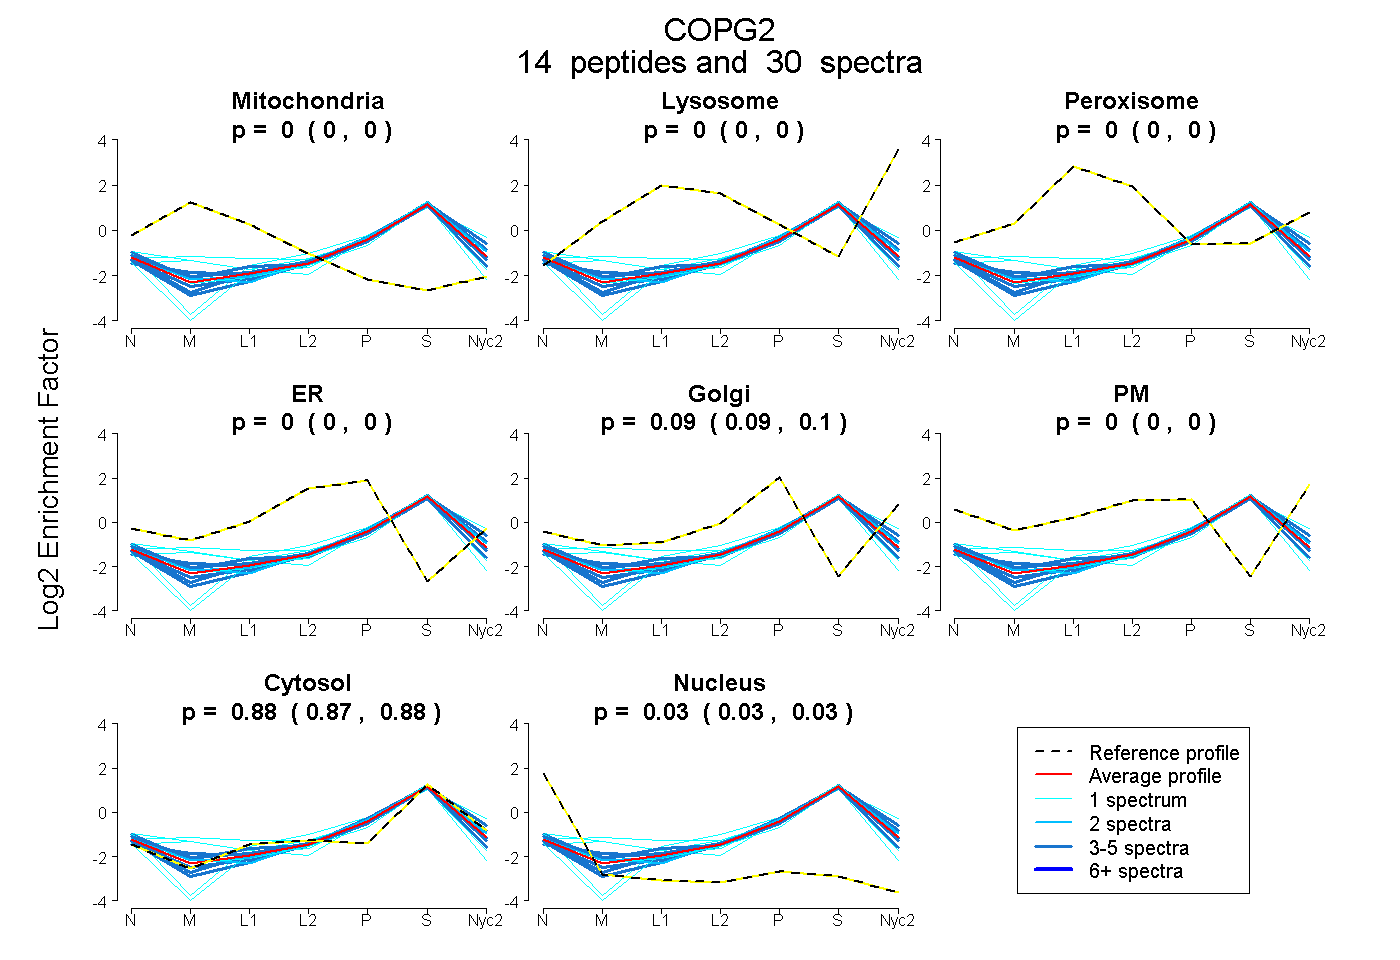
0.000 | 0.000
0.000 | 0.000
0.000 | 0.000
0.000 | 0.000
0.090 | 0.097
0.000 | 0.000
0.874 | 0.879
0.026 | 0.032
5peptides
spectra
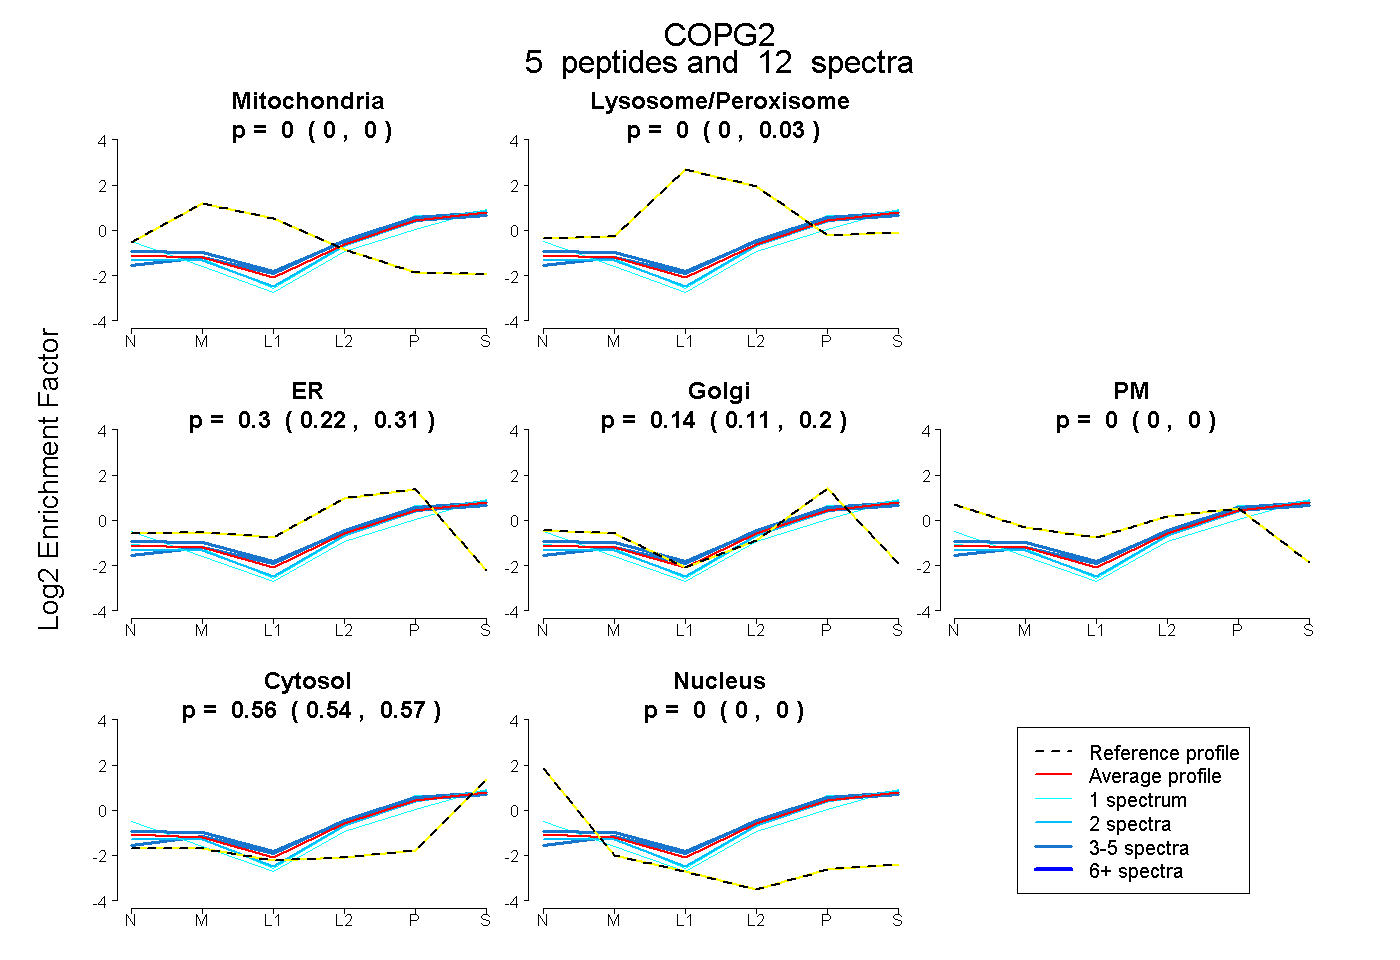
0.000 | 0.000
0.000 | 0.031
0.216 | 0.312
0.112 | 0.197
0.000 | 0.000
0.537 | 0.570
0.000 | 0.000
8peptides
spectra
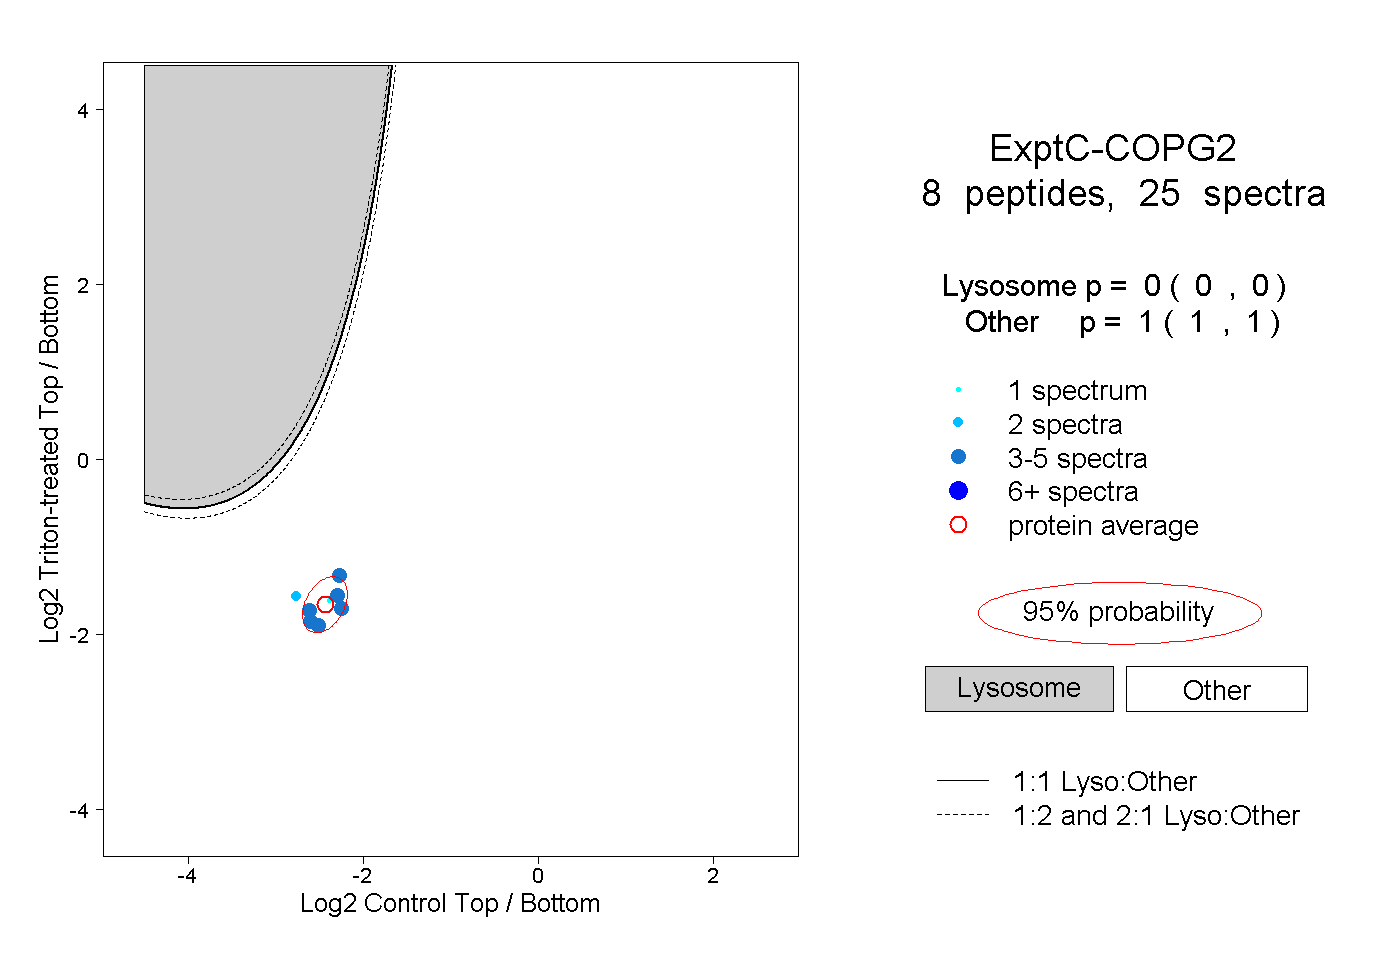
0.000 | 0.000
1.000 | 1.000
3peptides
spectra
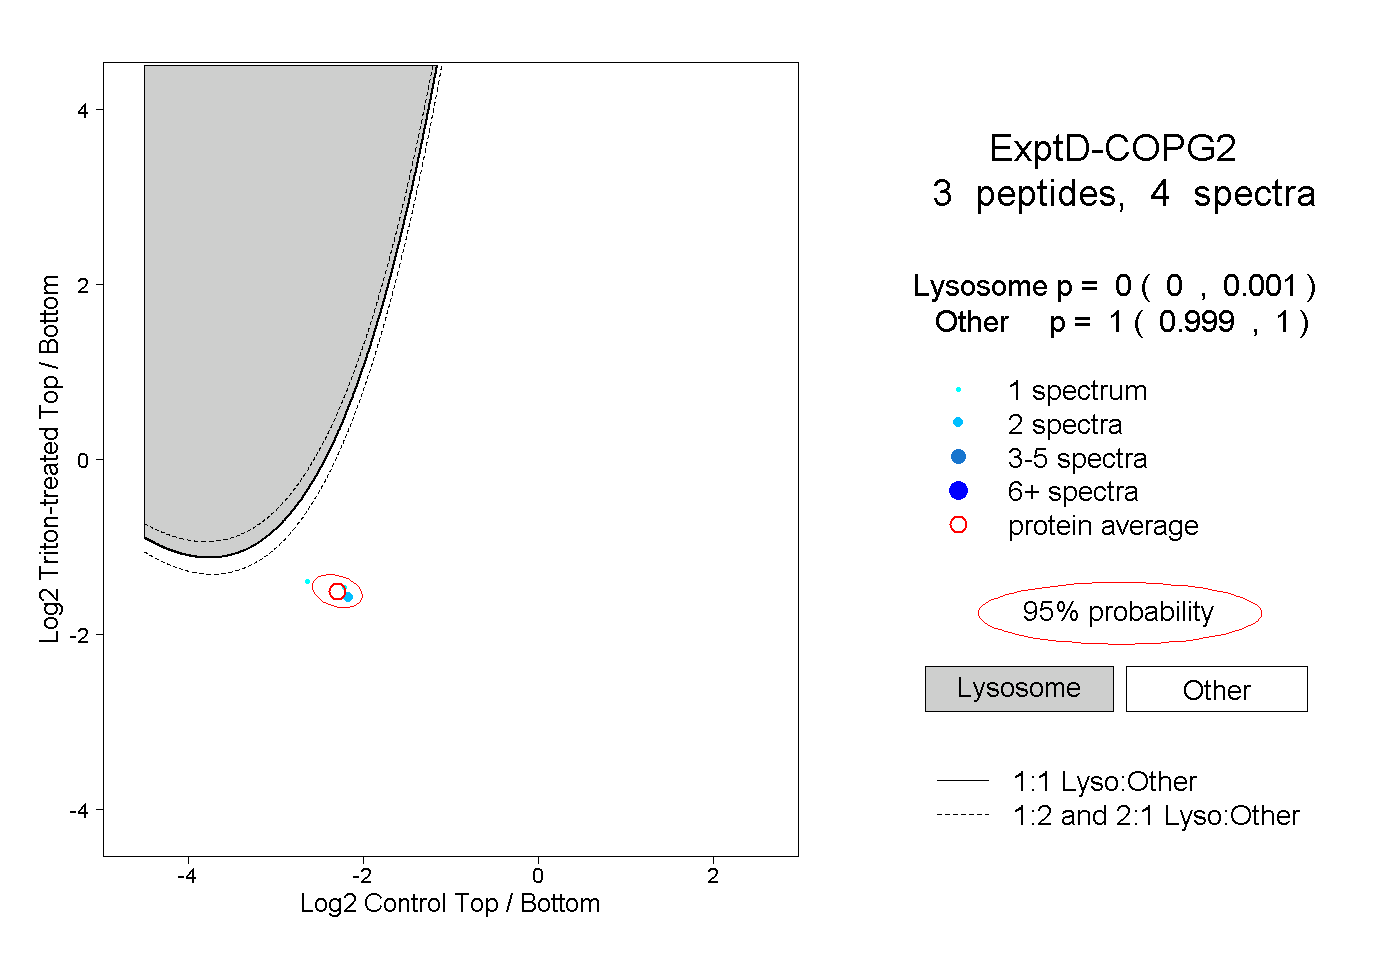
0.000 | 0.001
0.999 | 1.000