COPG2
[ENSRNOP00000038134]
Main page
| | | Plot |
Mito |
Lyso |
|
Perox |
ER |
Golgi |
PM |
Cytosol |
Nucleus |
|
| Expt A |
 14
14
peptides |
30
spectra |
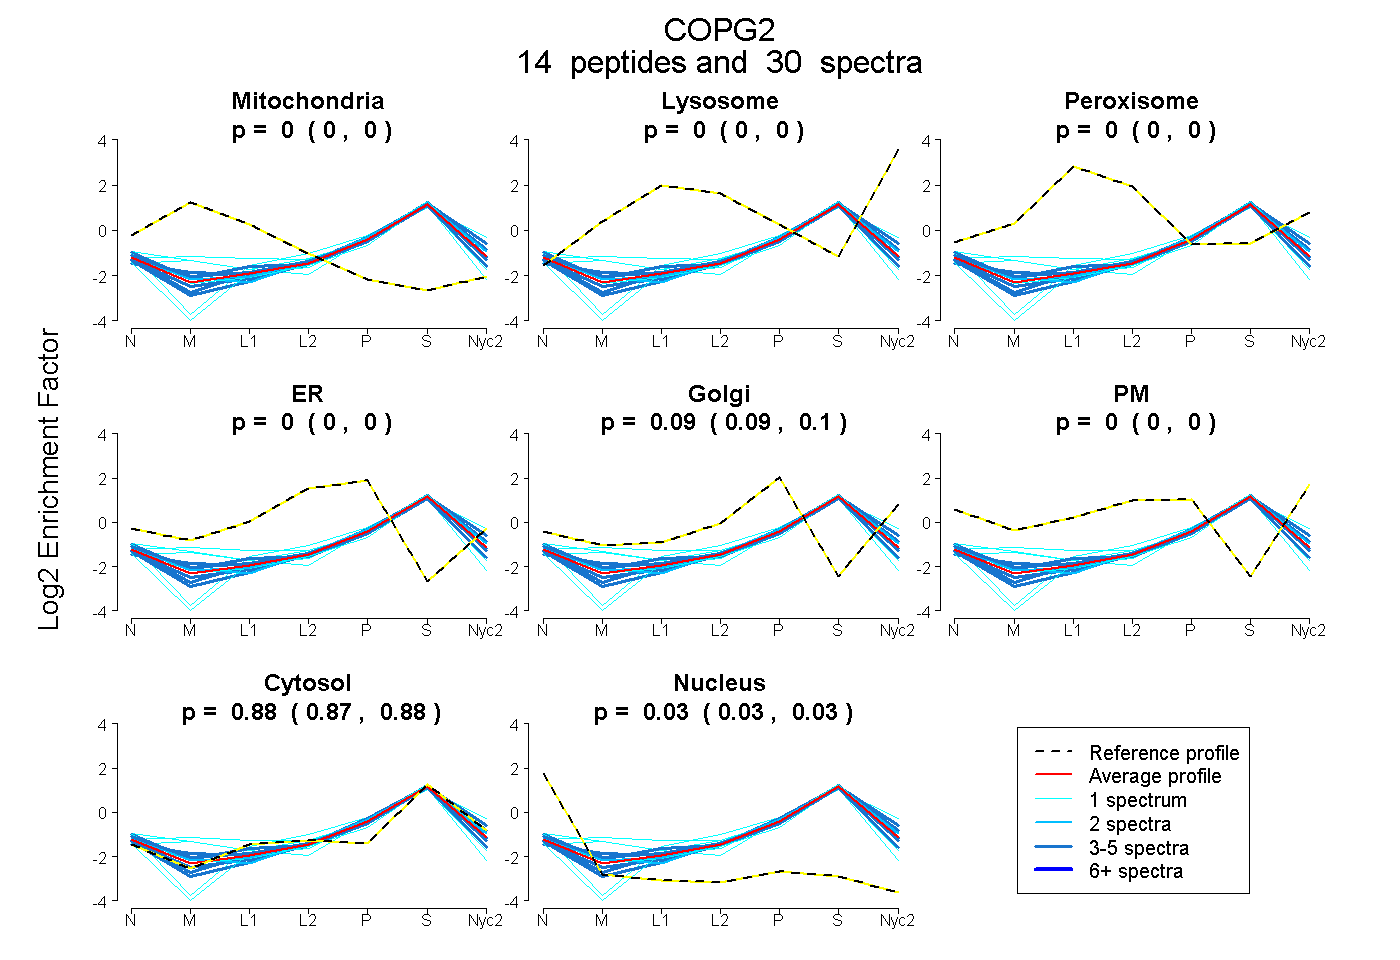 |
0.000
0.000 | 0.000 |
0.000
0.000 | 0.000 |
|
0.000
0.000 | 0.000 |
0.000
0.000 | 0.000 |
0.094
0.090 | 0.097 |
0.000
0.000 | 0.000 |
0.877
0.874 | 0.879 |
0.029
0.026 | 0.032 |
|
| | | Plot |
Mito |
|
Lyso or Perox |
|
ER |
Golgi |
PM |
Cytosol |
Nucleus |
|
| Expt B |
5
peptides |
12
spectra |
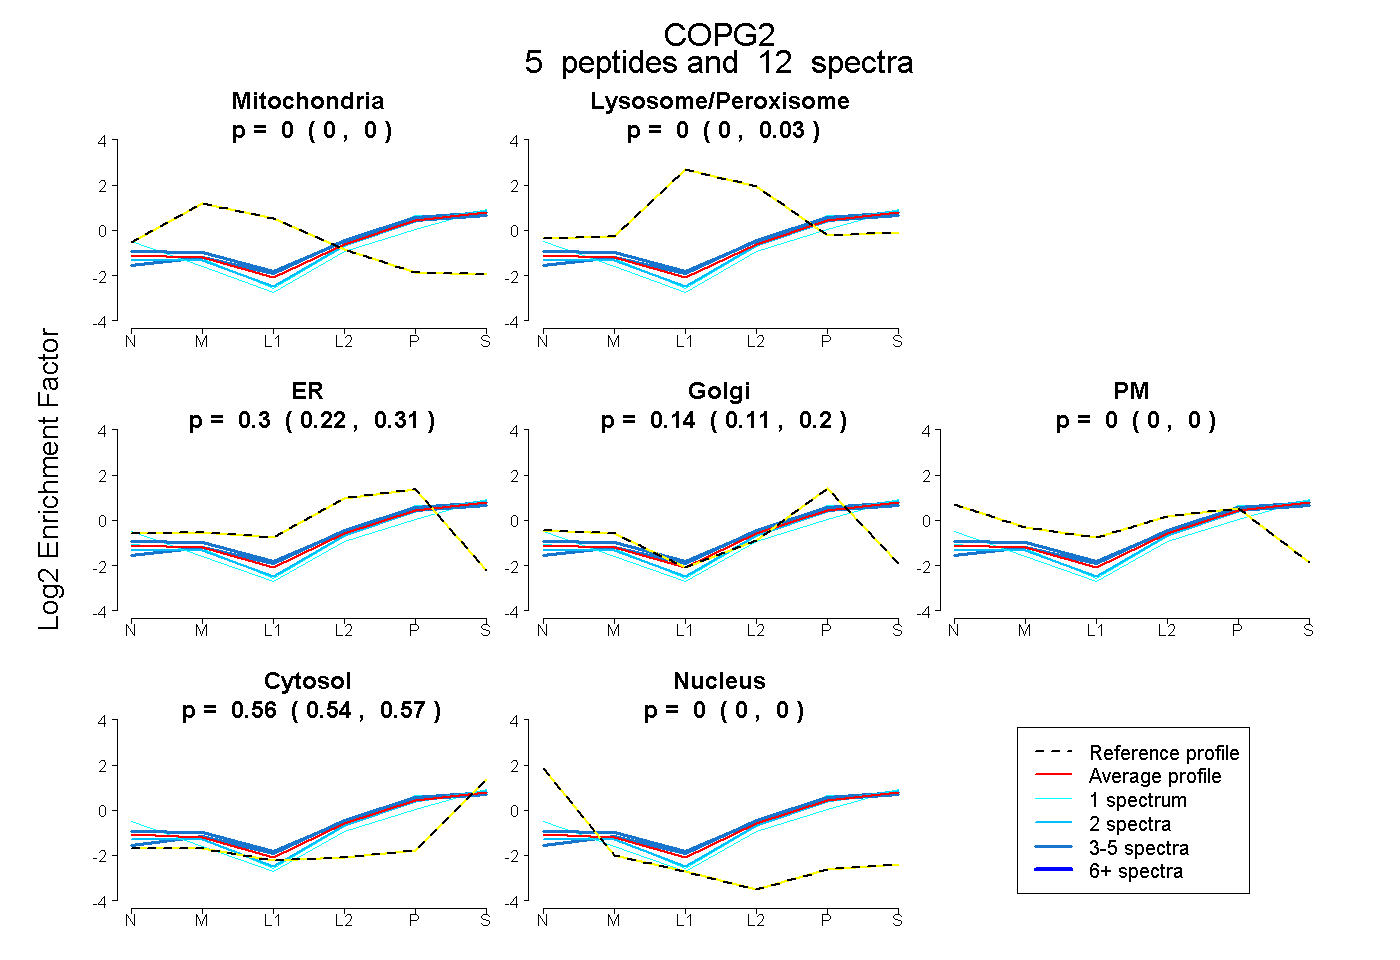 |
0.000
0.000 | 0.000 |
|
0.000
0.000 | 0.031 |
|
0.298
0.216 | 0.312 |
0.140
0.112 | 0.197 |
0.000
0.000 | 0.000 |
0.562
0.537 | 0.570 |
0.000
0.000 | 0.000 |
|
| | | Plot |
|
Lyso |
|
|
|
|
|
|
|
Other |
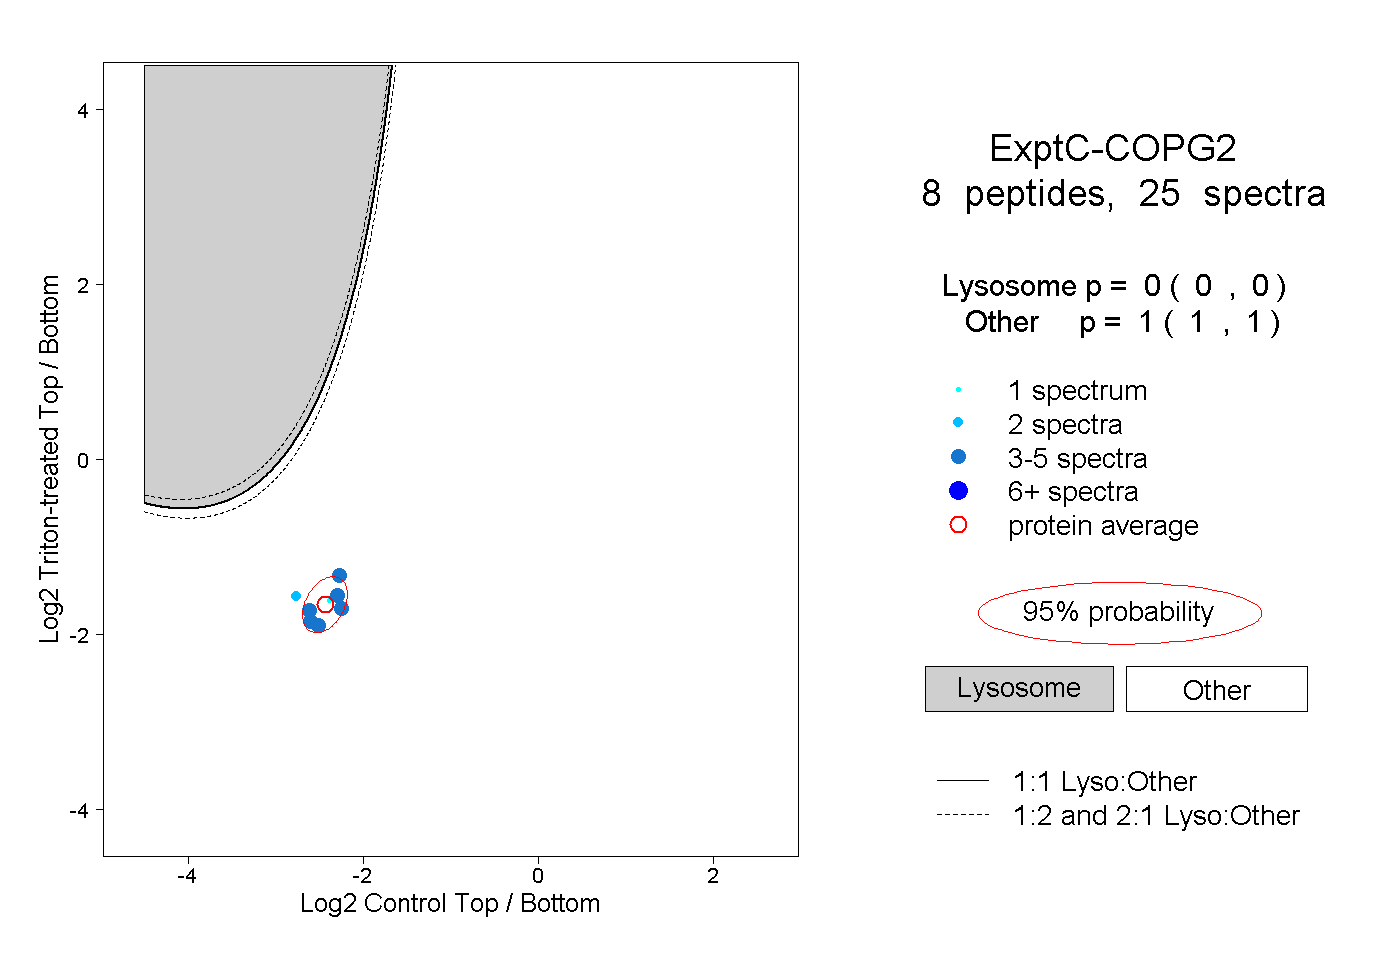
| Expt C |
8
peptides |
25
spectra |
 |
|
0.000
0.000 | 0.000 |
|
|
|
|
|
|
|
1.000
1.000 | 1.000 |
| 5 spectra, ILHLLGK |
|
0.000 |
|
|
|
|
|
|
|
1.000 |
| 3 spectra, IFNETPINPR |
|
0.000 |
|
|
|
|
|
|
|
1.000 |
| 4 spectra, AAAVSALAK |
|
0.000 |
|
|
|
|
|
|
|
1.000 |
| 2 spectra, ITDGTMLQAIER |
|
0.000 |
|
|
|
|
|
|
|
1.000 |
| 3 spectra, VVLENEAVR |
|
0.000 |
|
|
|
|
|
|
|
1.000 |
| 1 spectrum, LFQSNDQTLR |
|
0.000 |
|
|
|
|
|
|
|
1.000 |
| 3 spectra, SEITLVTPKPEK |
|
0.000 |
|
|
|
|
|
|
|
1.000 |
| 4 spectra, DDGGFEYK |
|
0.000 |
|
|
|
|
|
|
|
1.000 |
| | | Plot |
|
Lyso |
|
|
|
|
|
|
|
Other |
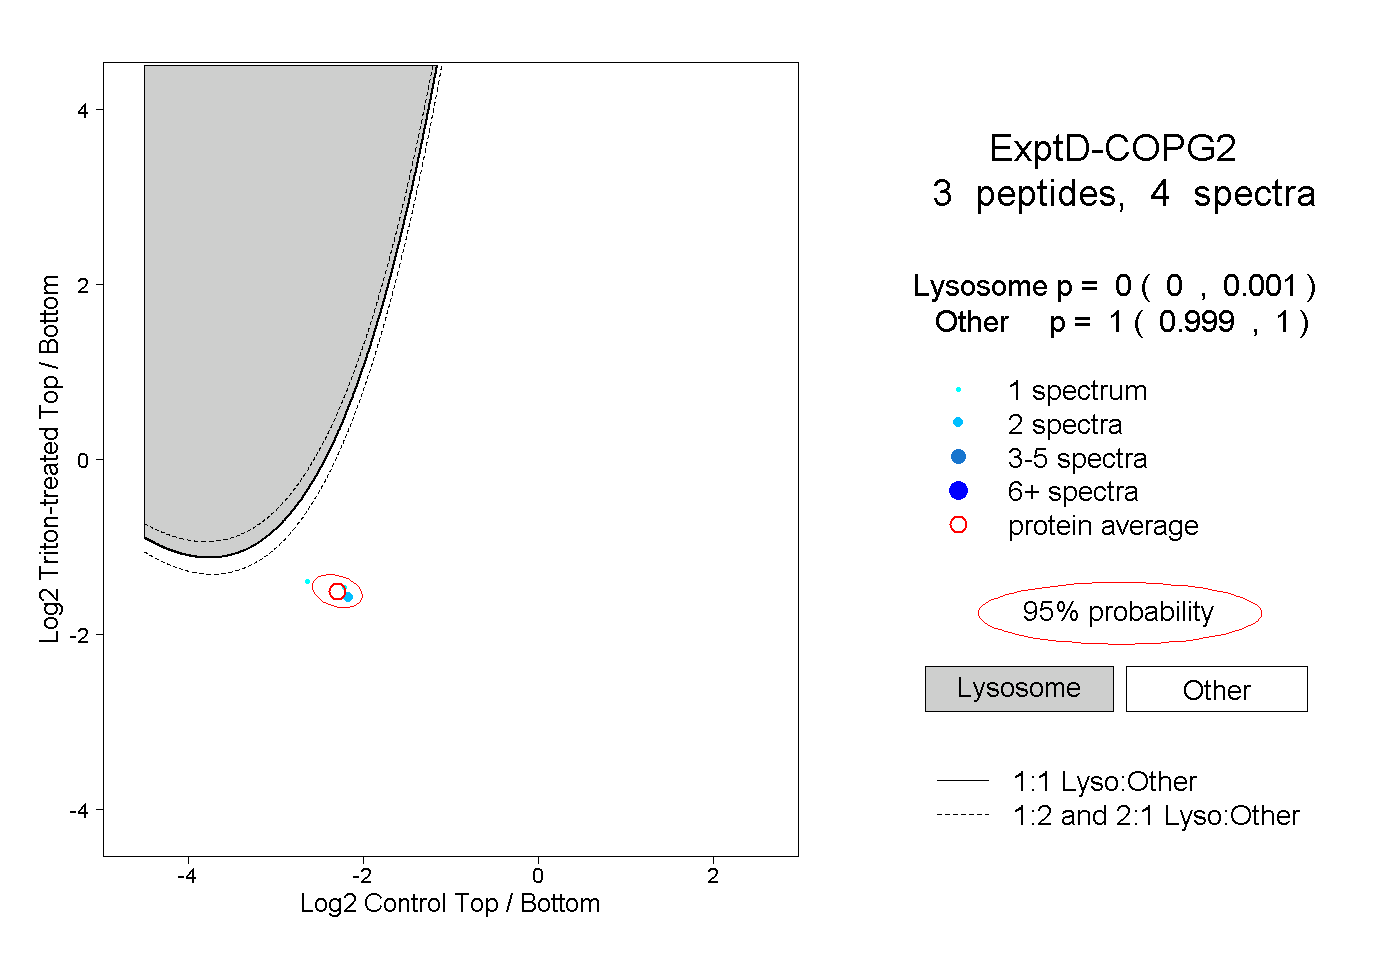
| Expt D |
3
peptides |
4
spectra |
 |
|
0.000
0.000 | 0.001 |
|
|
|
|
|
|
|
1.000
0.999 | 1.000 |