 4
4peptides
spectra
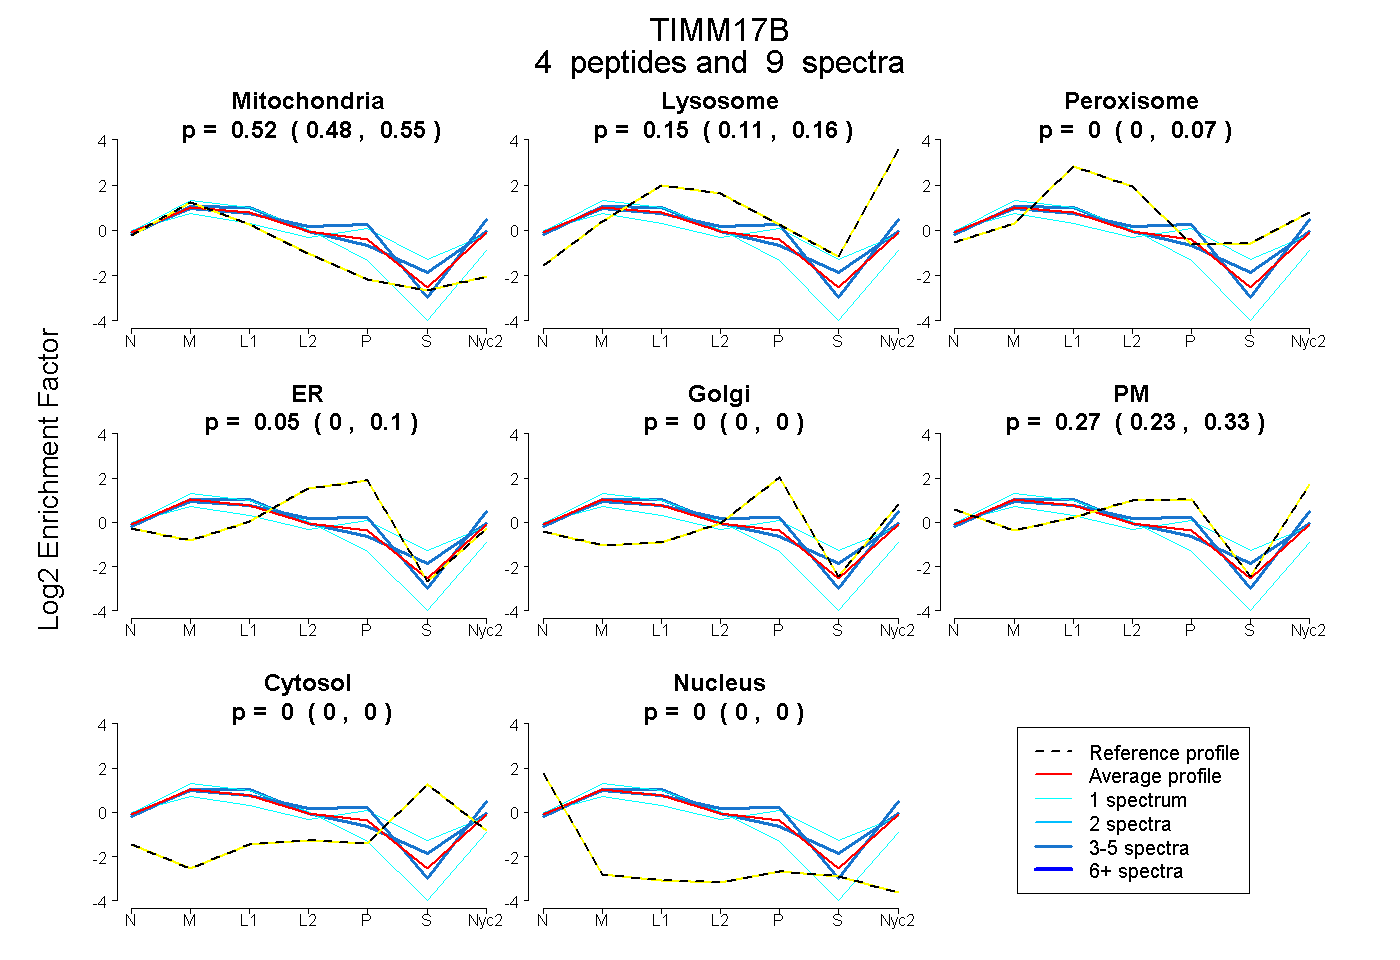
0.482 | 0.545
0.105 | 0.163
0.000 | 0.071
0.000 | 0.095
0.000 | 0.000
0.230 | 0.328
0.000 | 0.000
0.000 | 0.000
3peptides
spectra
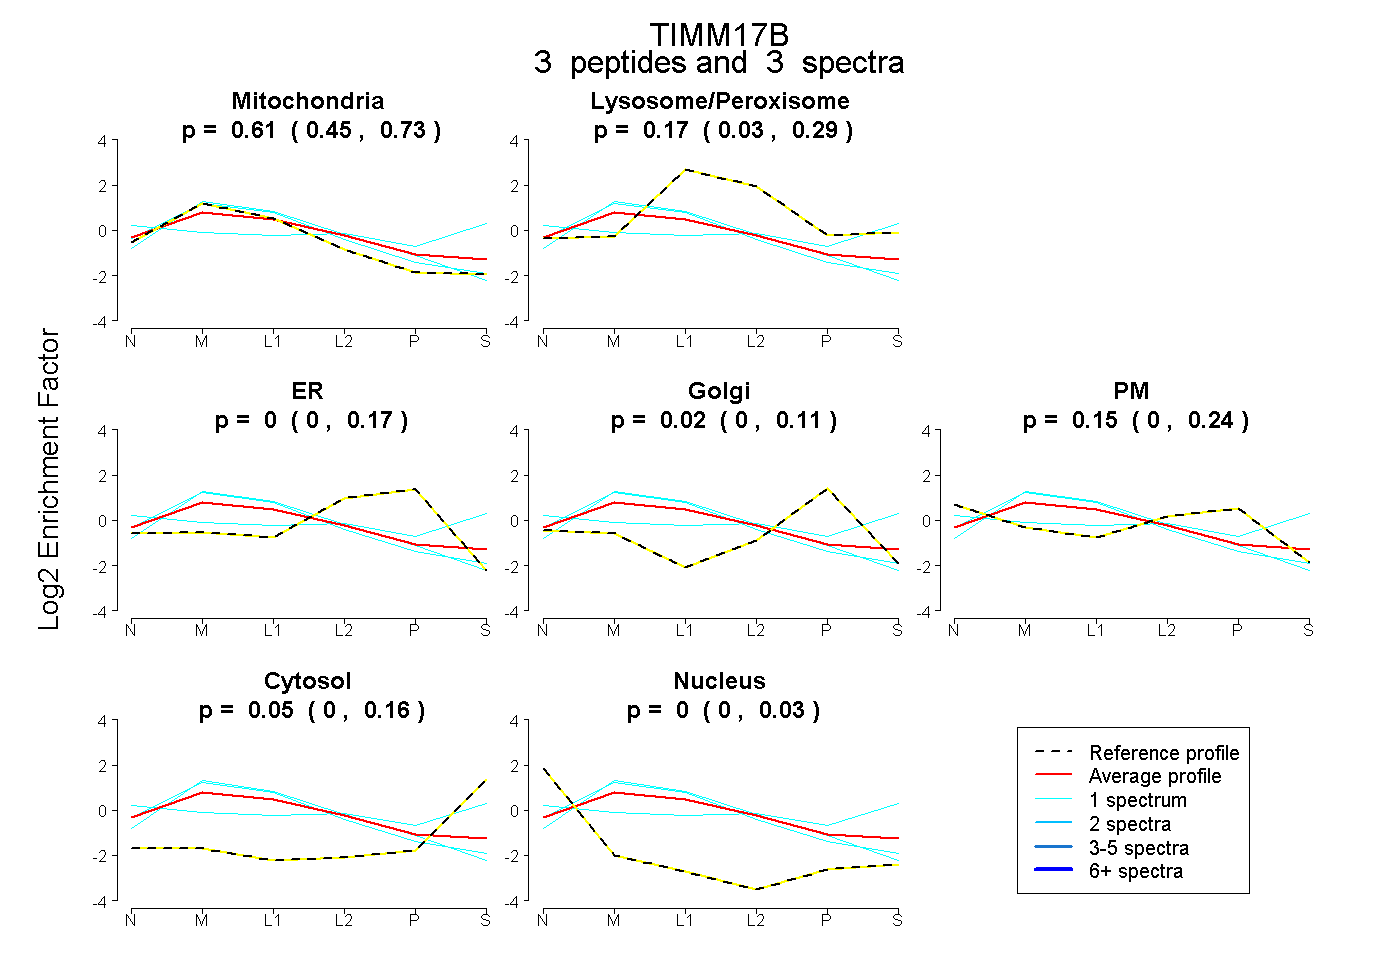
0.446 | 0.730
0.031 | 0.287
0.000 | 0.168
0.000 | 0.109
0.000 | 0.242
0.000 | 0.159
0.000 | 0.035
5peptides
spectra
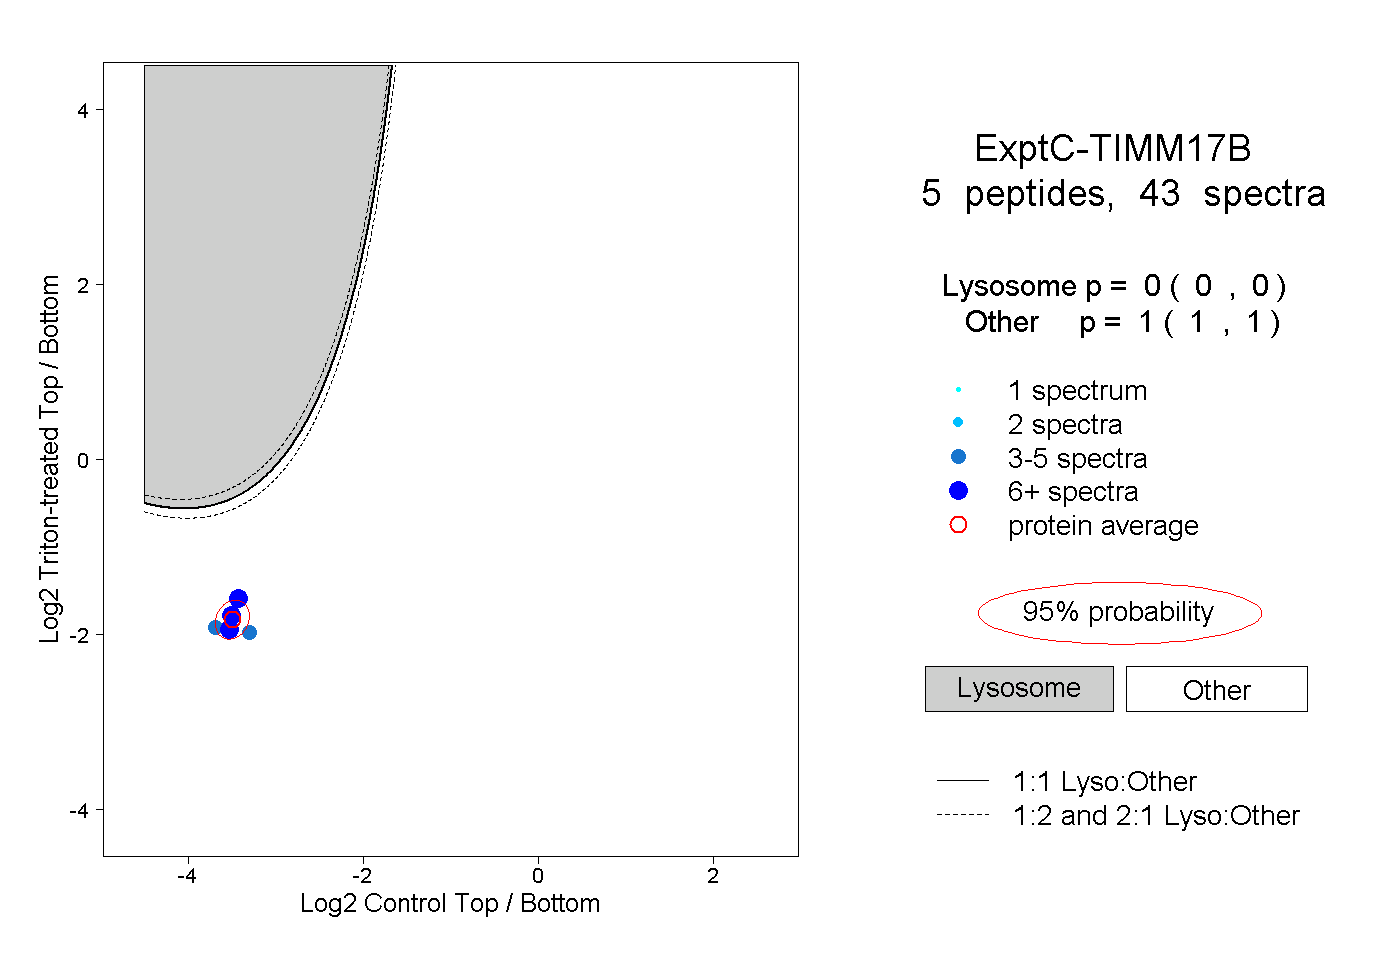
0.000 | 0.000
1.000 | 1.000
4peptides
spectra
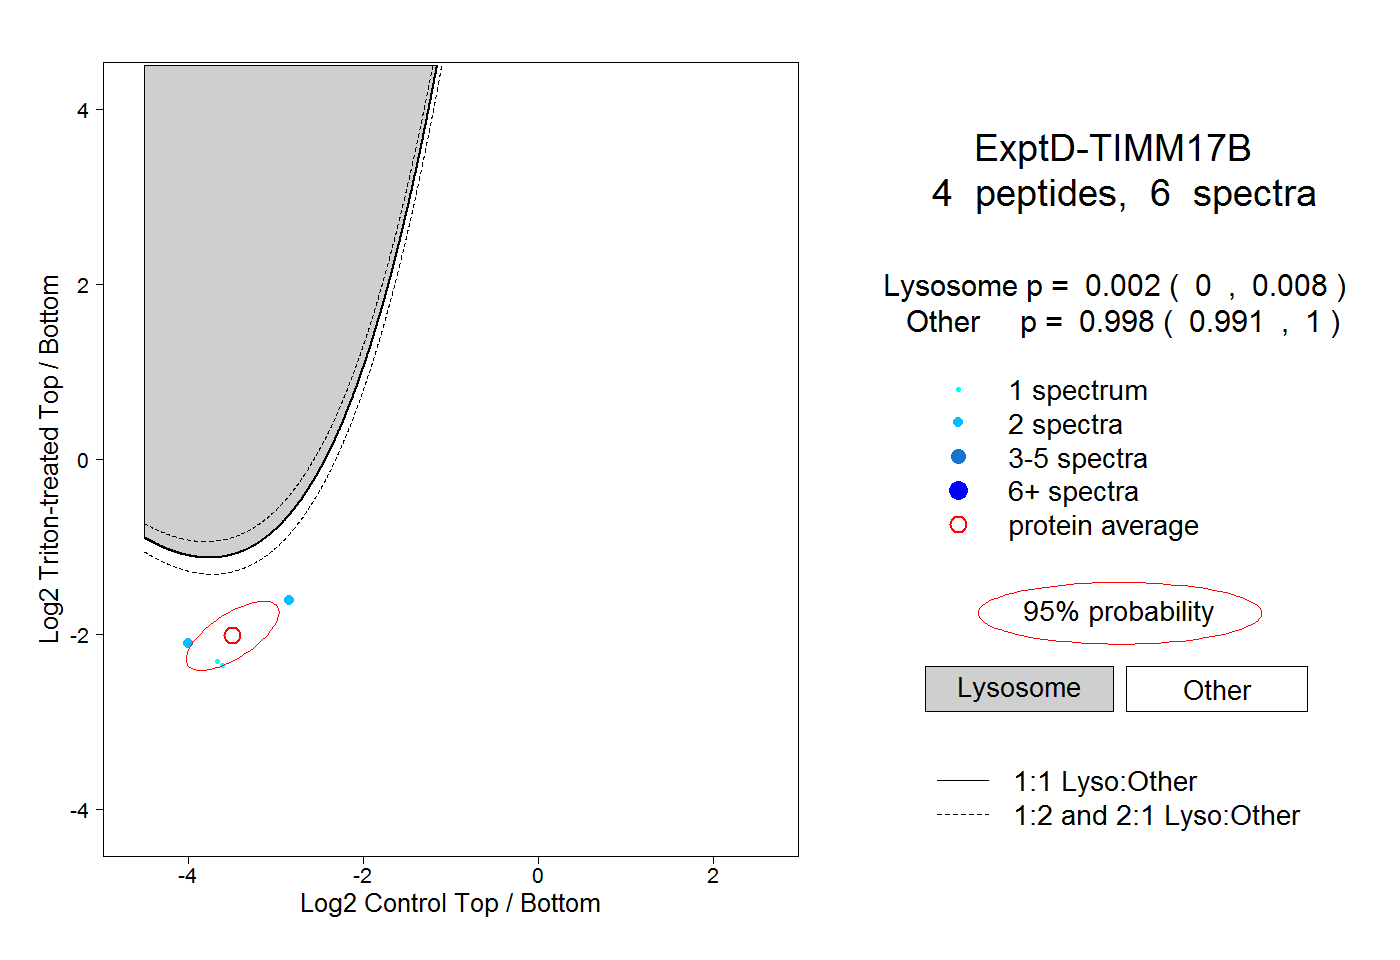
0.000 | 0.008
0.991 | 1.000