 4
4peptides
spectra
0.482 | 0.545
0.105 | 0.163
0.000 | 0.071
0.000 | 0.095
0.000 | 0.000
0.230 | 0.328
0.000 | 0.000
0.000 | 0.000
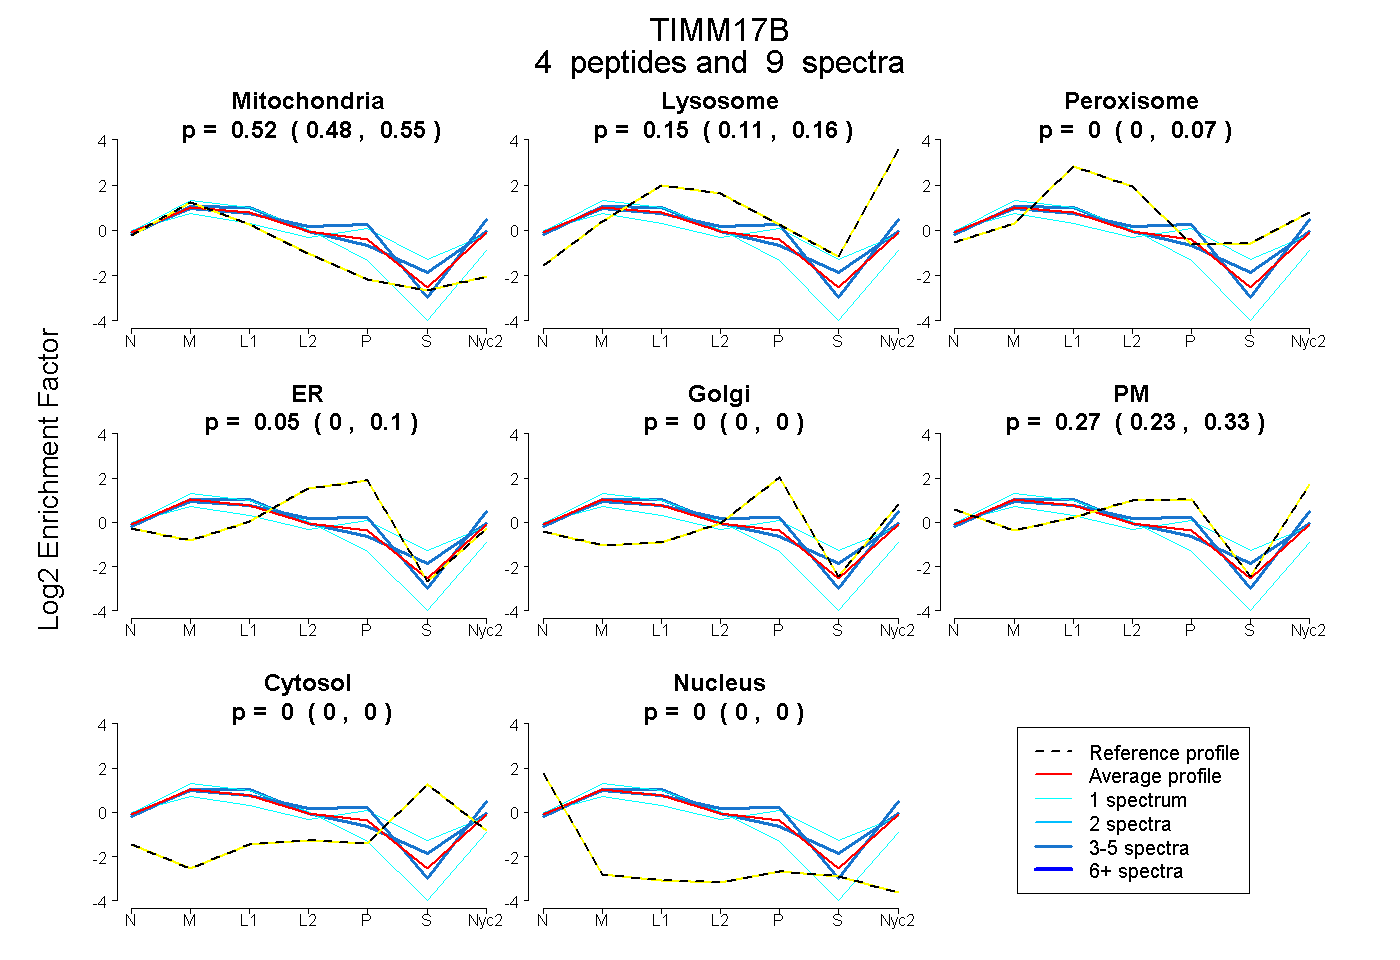
| Plot | Mito | Lyso | Perox | ER | Golgi | PM | Cytosol | Nucleus | |||||
| Expt A |
4 peptides |
9 spectra |
|
0.521 0.482 | 0.545 |
0.150 0.105 | 0.163 |
0.004 0.000 | 0.071 |
0.051 0.000 | 0.095 |
0.000 0.000 | 0.000 |
0.275 0.230 | 0.328 |
0.000 0.000 | 0.000 |
0.000 0.000 | 0.000 |
| 1 spectrum, NAPVGIR | 0.358 | 0.006 | 0.209 | 0.000 | 0.291 | 0.080 | 0.056 | 0.000 | ||
| 3 spectra, EPCPWR | 0.505 | 0.149 | 0.161 | 0.000 | 0.012 | 0.173 | 0.000 | 0.000 | ||
| 1 spectrum, IVDDCGGAFTMGVIGGGVFQAVK | 0.723 | 0.042 | 0.000 | 0.031 | 0.000 | 0.204 | 0.000 | 0.000 | ||
| 4 spectra, YTAQQFR | 0.372 | 0.130 | 0.000 | 0.060 | 0.000 | 0.438 | 0.000 | 0.000 |
| Plot | Mito | Lyso or Perox | ER | Golgi | PM | Cytosol | Nucleus | ||||||
| Expt B |
3 peptides |
3 spectra |
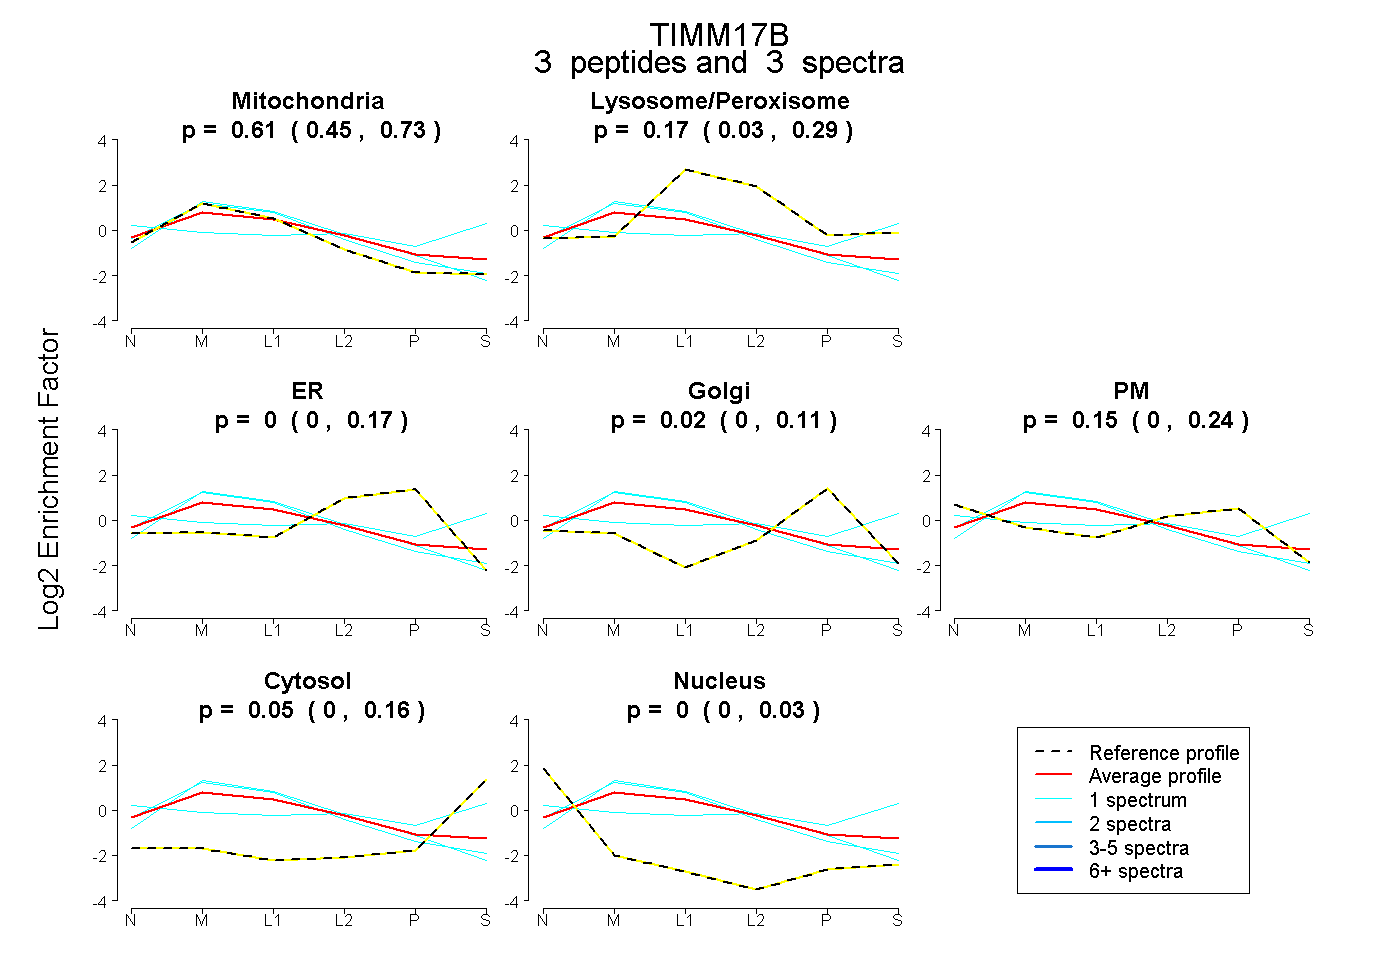 |
0.609 0.446 | 0.730 |
0.174 0.031 | 0.287 |
0.000 0.000 | 0.168 |
0.021 0.000 | 0.109 |
0.151 0.000 | 0.242 |
0.045 0.000 | 0.159 |
0.000 0.000 | 0.035 |
|||
| Plot | Lyso | Other | |||||||||||
| Expt C |
5 peptides |
43 spectra |
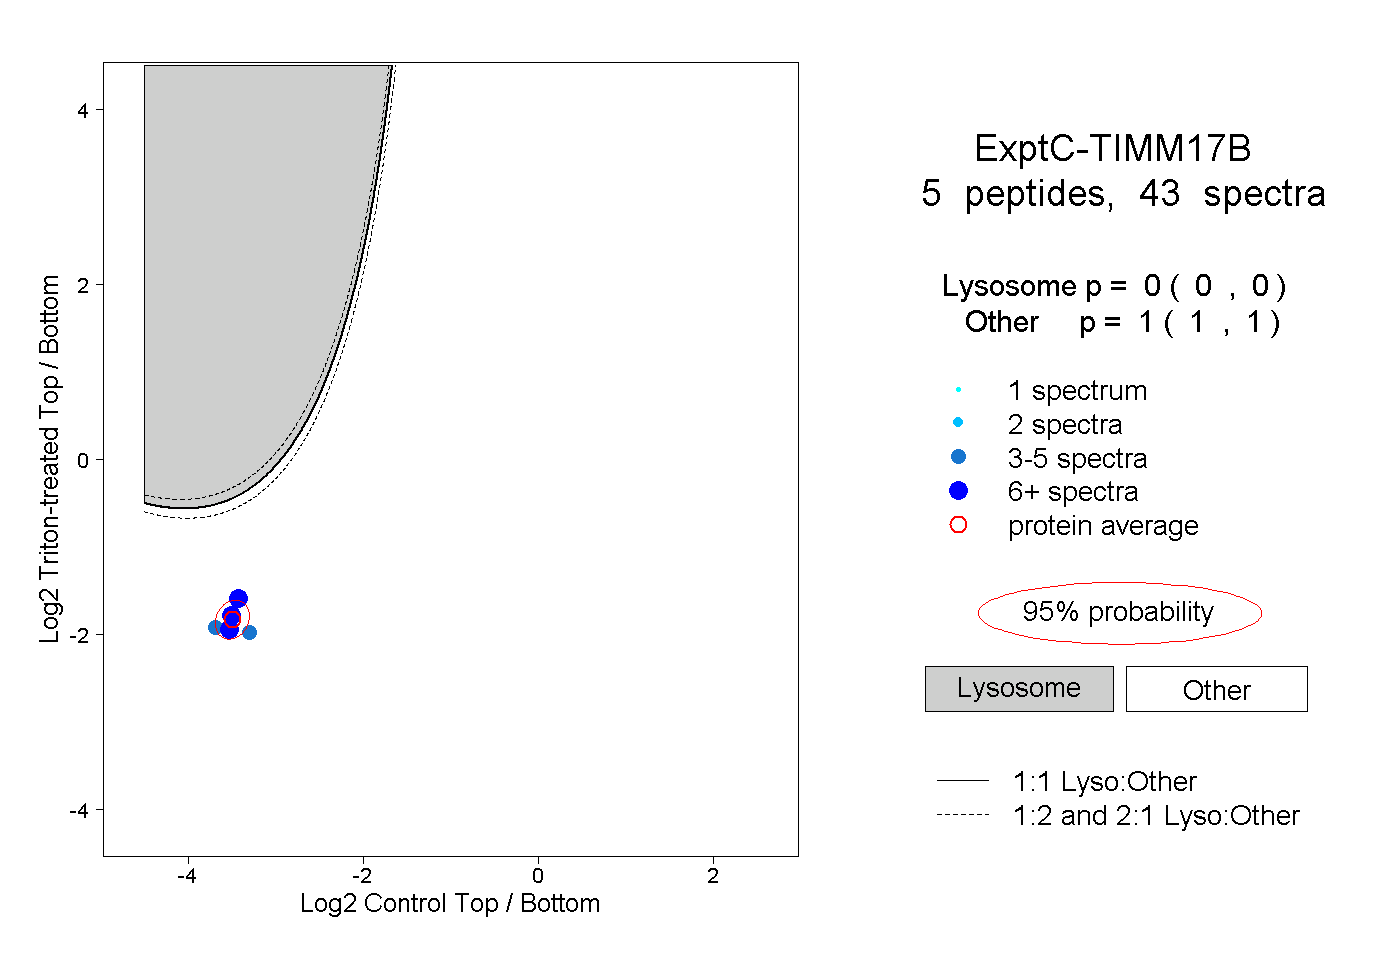 |
0.000 0.000 | 0.000 |
1.000 1.000 | 1.000 |
||||||||
| Plot | Lyso | Other | |||||||||||
| Expt D |
4 peptides |
6 spectra |
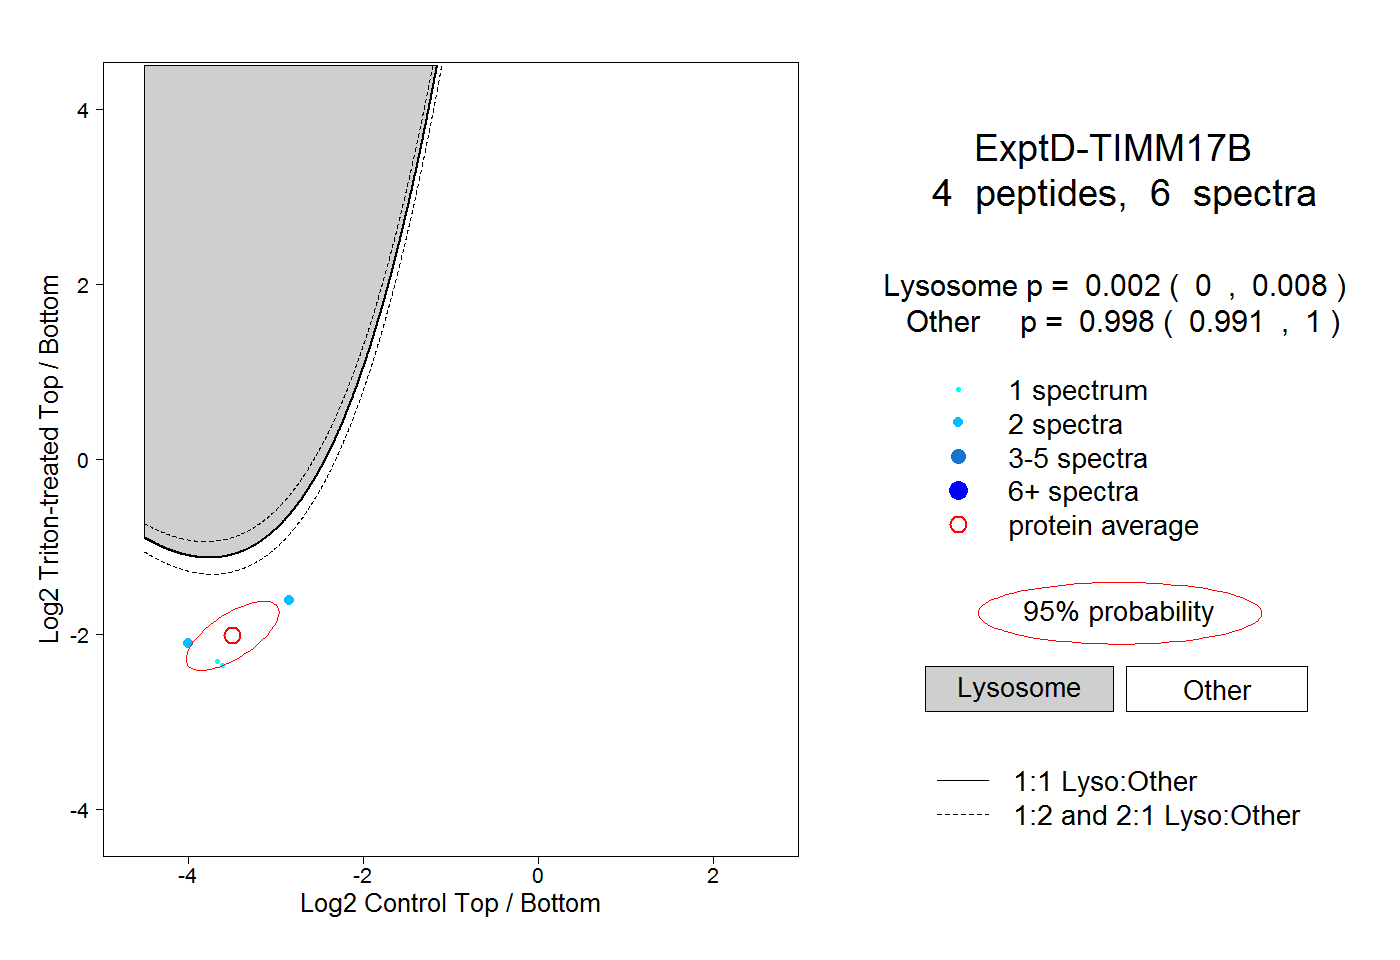 |
0.002 0.000 | 0.008 |
0.998 0.991 | 1.000 |