 37
37peptides
spectra
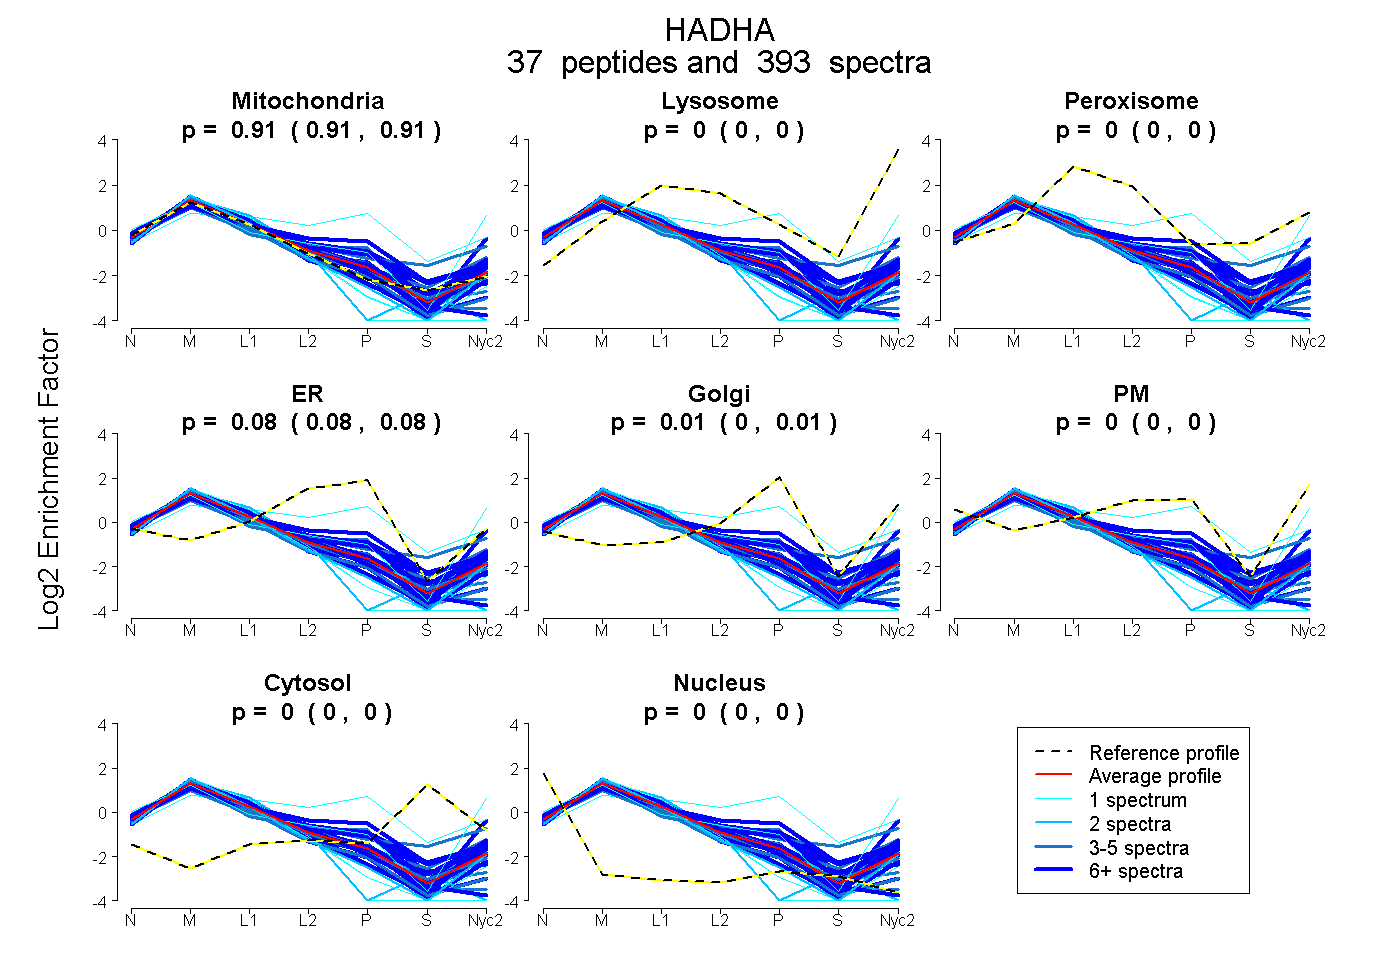
0.910 | 0.913
0.000 | 0.000
0.000 | 0.000
0.079 | 0.084
0.003 | 0.009
0.000 | 0.000
0.000 | 0.000
0.000 | 0.000
30peptides
spectra
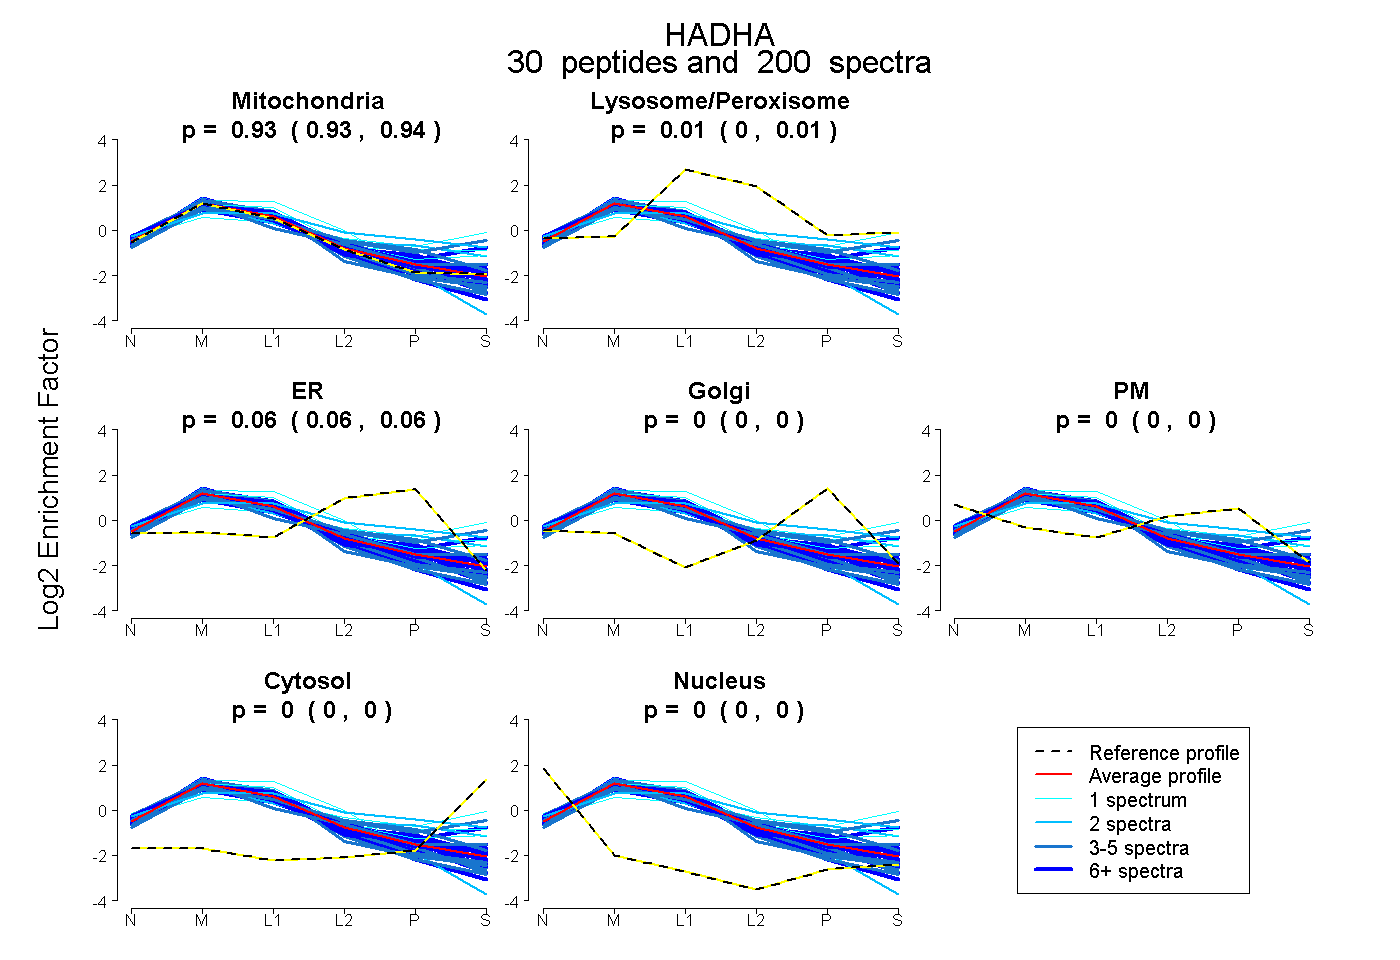
0.933 | 0.937
0.004 | 0.008
0.057 | 0.061
0.000 | 0.000
0.000 | 0.000
0.000 | 0.000
0.000 | 0.000
36peptides
spectra
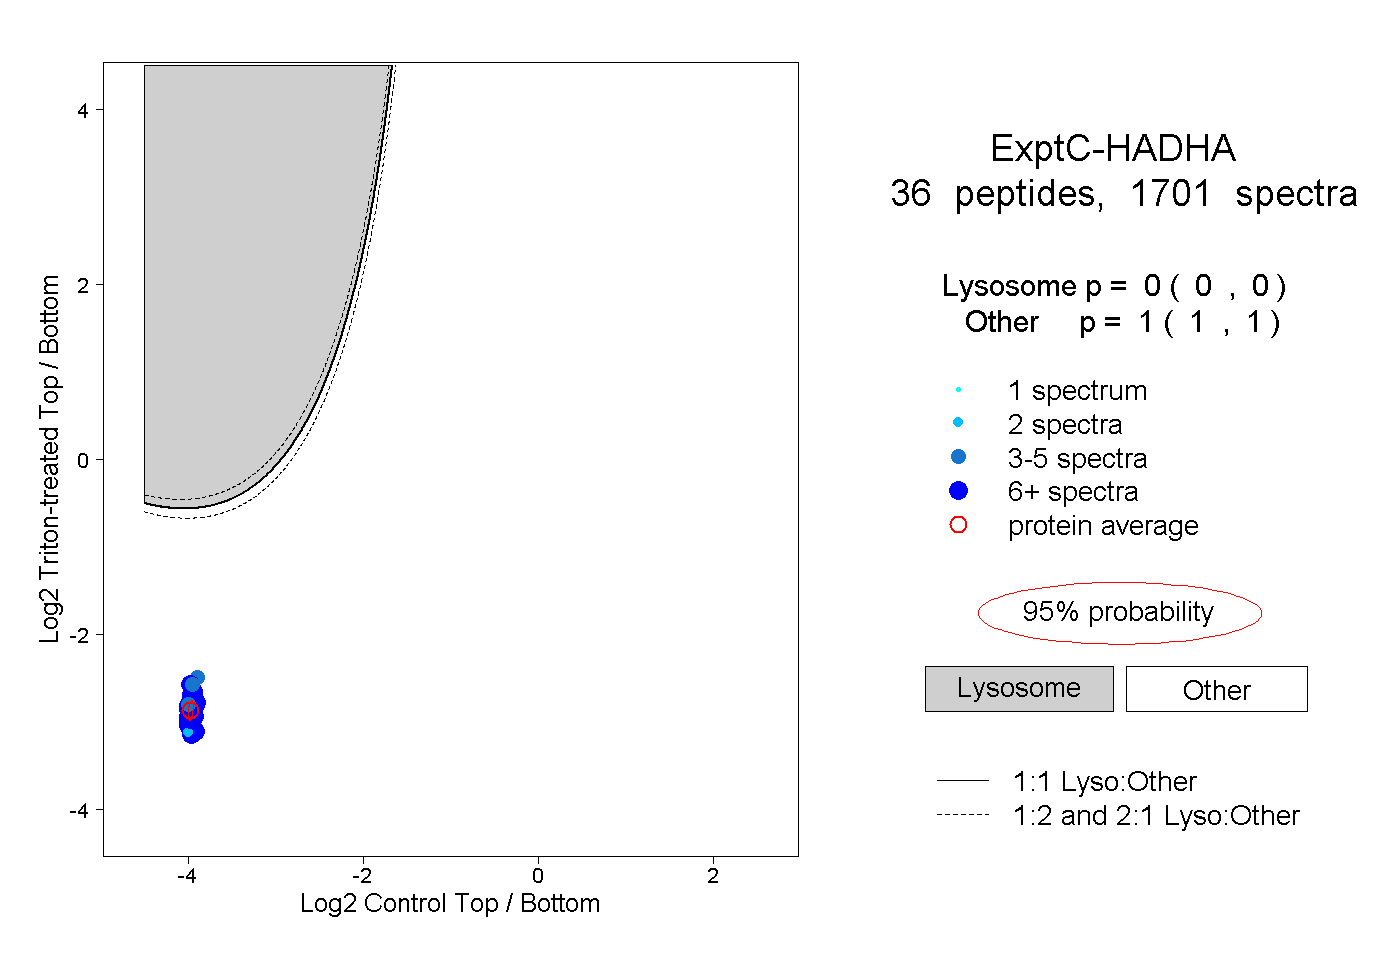
0.000 | 0.000
1.000 | 1.000
25peptides
spectra
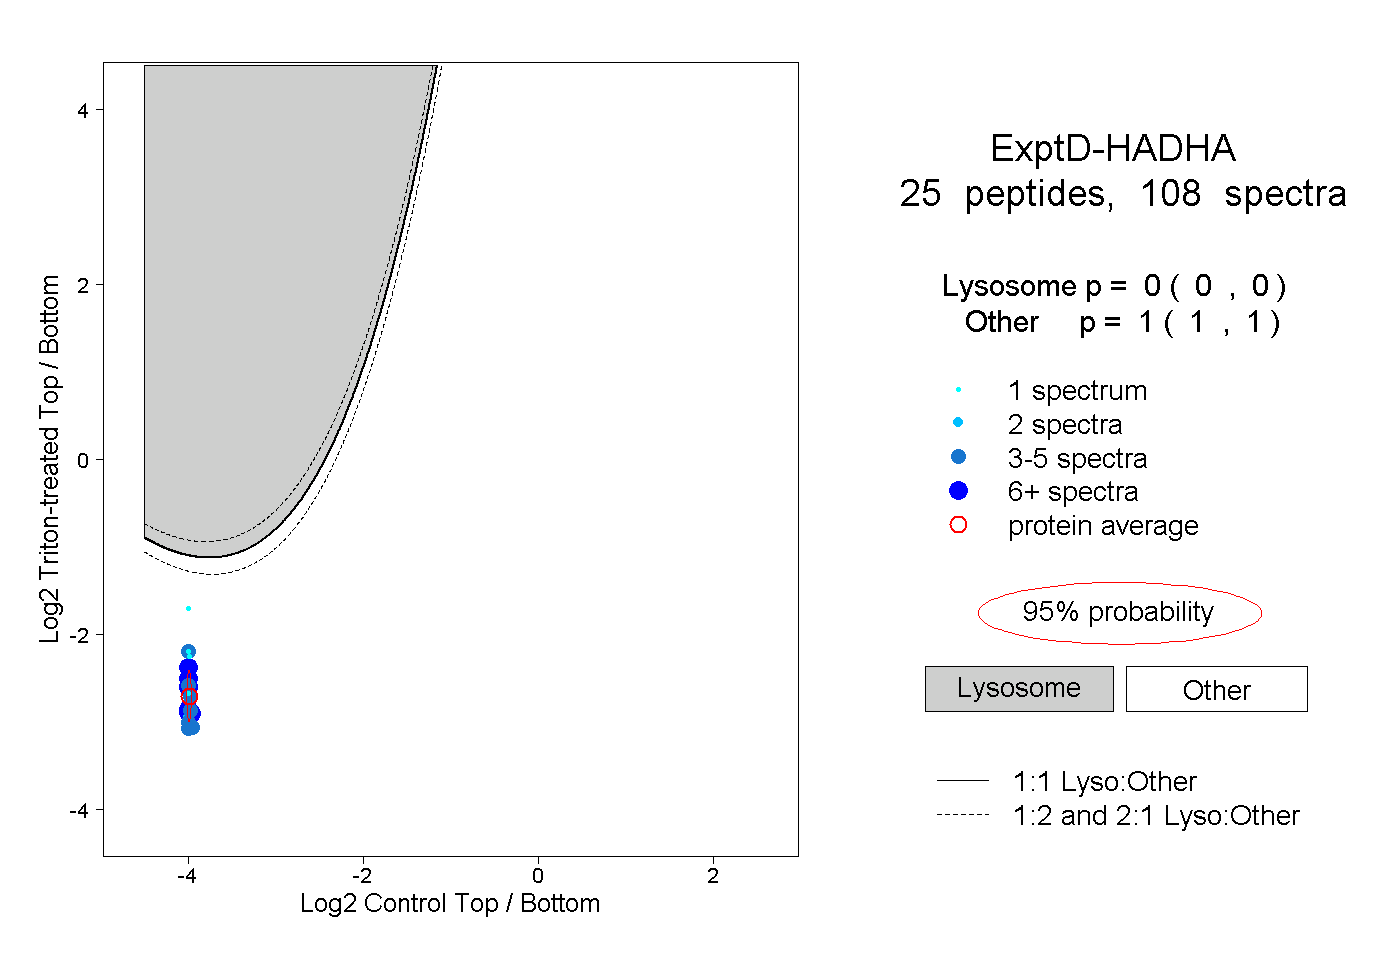
0.000 | 0.000
1.000 | 1.000