 3
3peptides
spectra
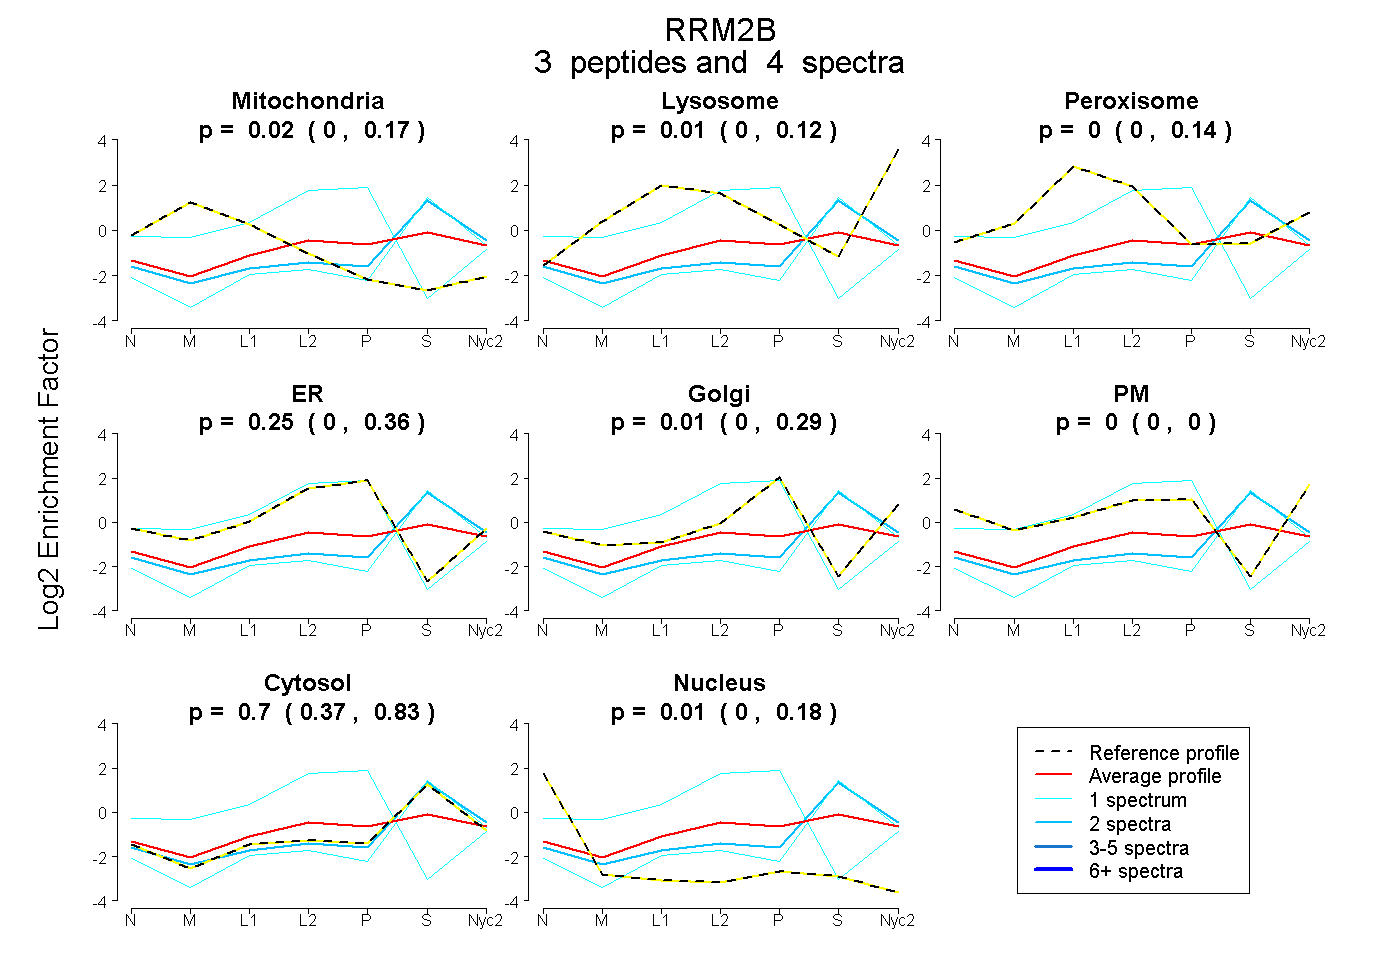
0.000 | 0.168
0.000 | 0.124
0.000 | 0.145
0.000 | 0.363
0.000 | 0.292
0.000 | 0.000
0.374 | 0.827
0.000 | 0.181
2peptides
spectra
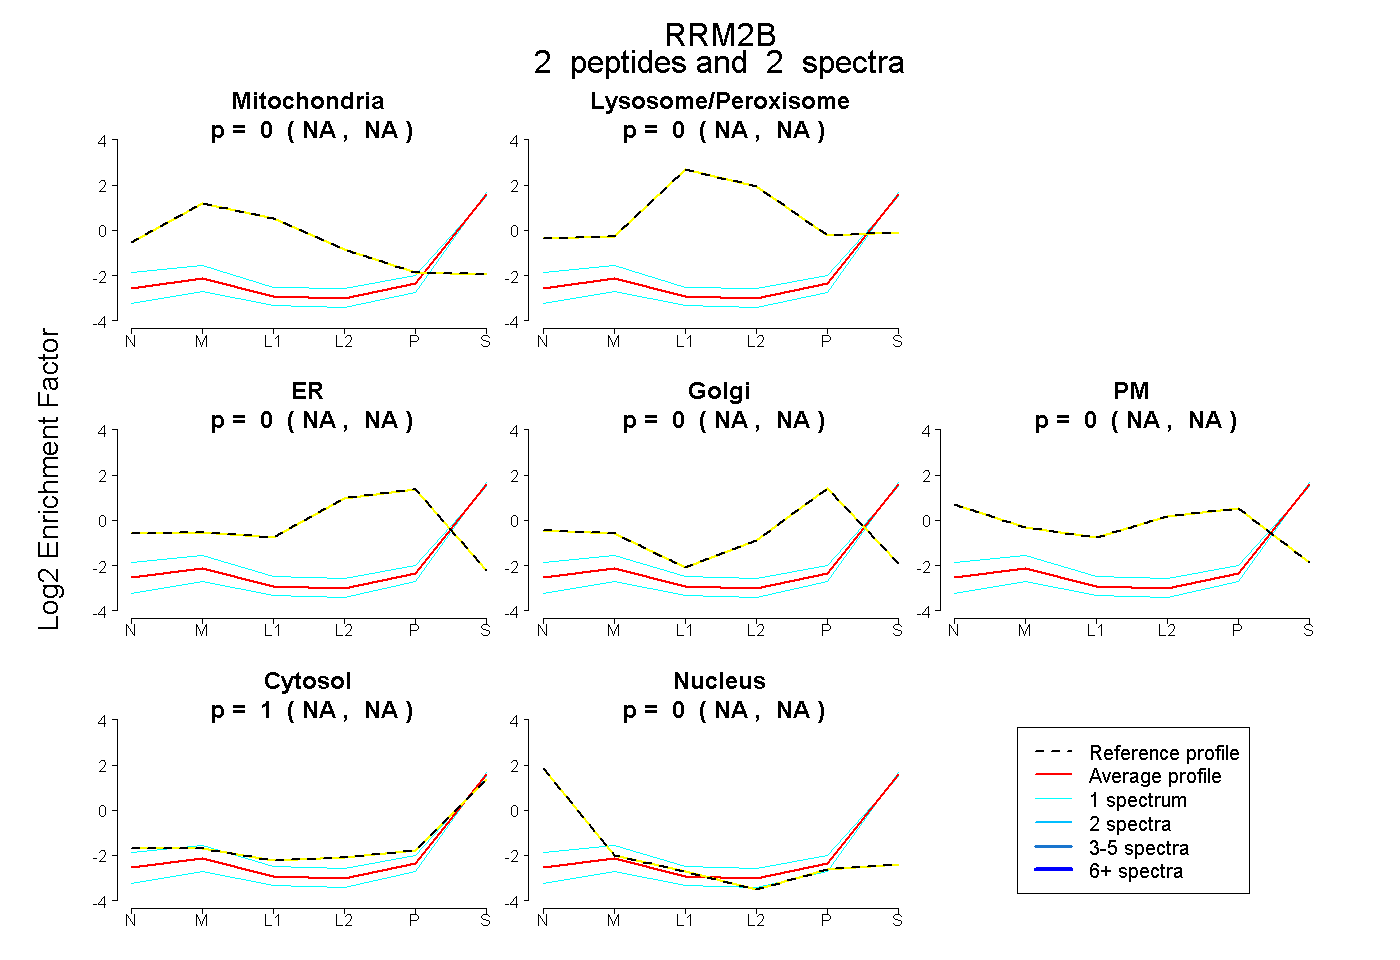
NA | NA
NA | NA
NA | NA
NA | NA
NA | NA
NA | NA
NA | NA
2peptides
spectra
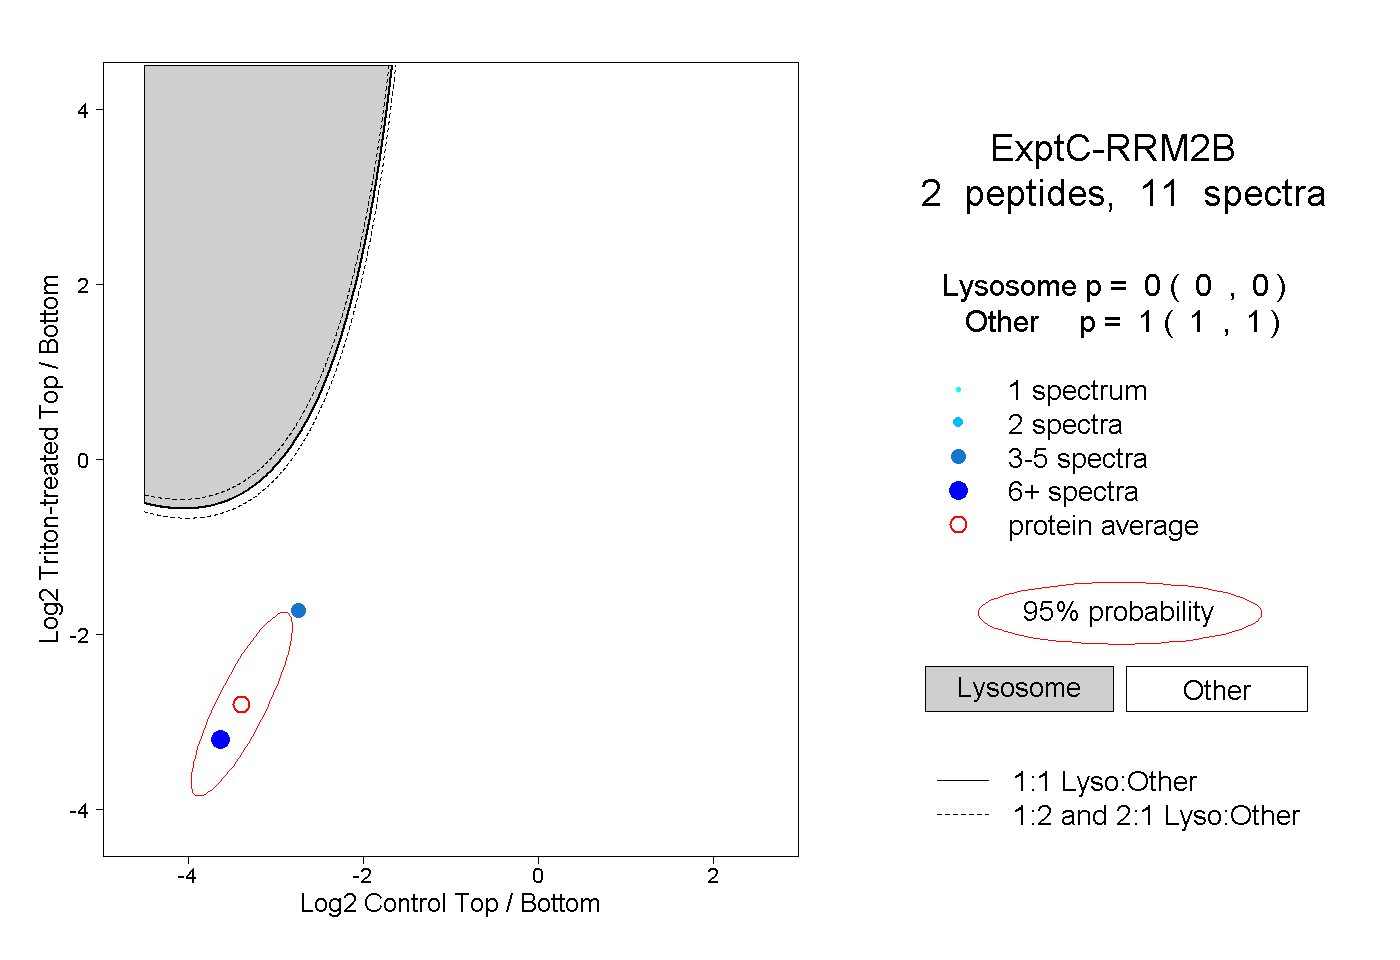
0.000 | 0.000
1.000 | 1.000