 3
3peptides
spectra
0.000 | 0.168
0.000 | 0.124
0.000 | 0.145
0.000 | 0.363
0.000 | 0.292
0.000 | 0.000
0.374 | 0.827
0.000 | 0.181
| Plot | Mito | Lyso | Perox | ER | Golgi | PM | Cytosol | Nucleus | |||||
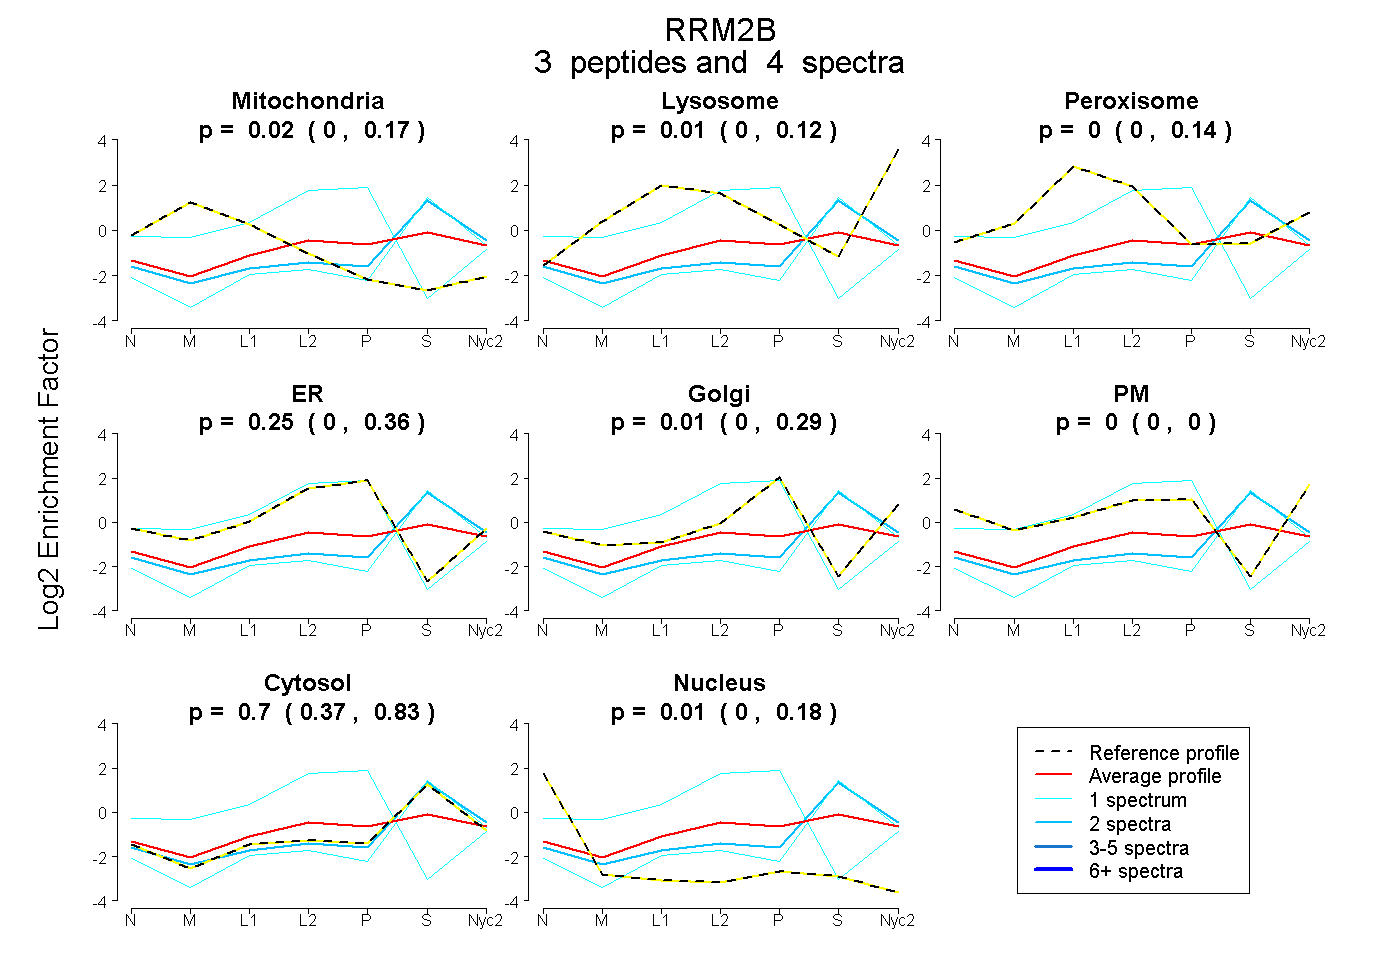
| Expt A |
3 peptides |
4 spectra |
|
0.023 0.000 | 0.168 |
0.013 0.000 | 0.124 |
0.000 0.000 | 0.145 |
0.250 0.000 | 0.363 |
0.008 0.000 | 0.292 |
0.000 0.000 | 0.000 |
0.696 0.374 | 0.827 |
0.010 0.000 | 0.181 |
| 1 spectrum, WIADR | 0.053 | 0.000 | 0.000 | 0.947 | 0.000 | 0.000 | 0.000 | 0.000 | ||
| 2 spectra, FSQEVQVPEAR | 0.000 | 0.007 | 0.000 | 0.000 | 0.000 | 0.000 | 0.993 | 0.000 | ||
| 1 spectrum, VMEIIVDAVK | 0.000 | 0.000 | 0.000 | 0.000 | 0.000 | 0.000 | 1.000 | 0.000 |
| Plot | Mito | Lyso or Perox | ER | Golgi | PM | Cytosol | Nucleus | ||||||
| Expt B |
2 peptides |
2 spectra |
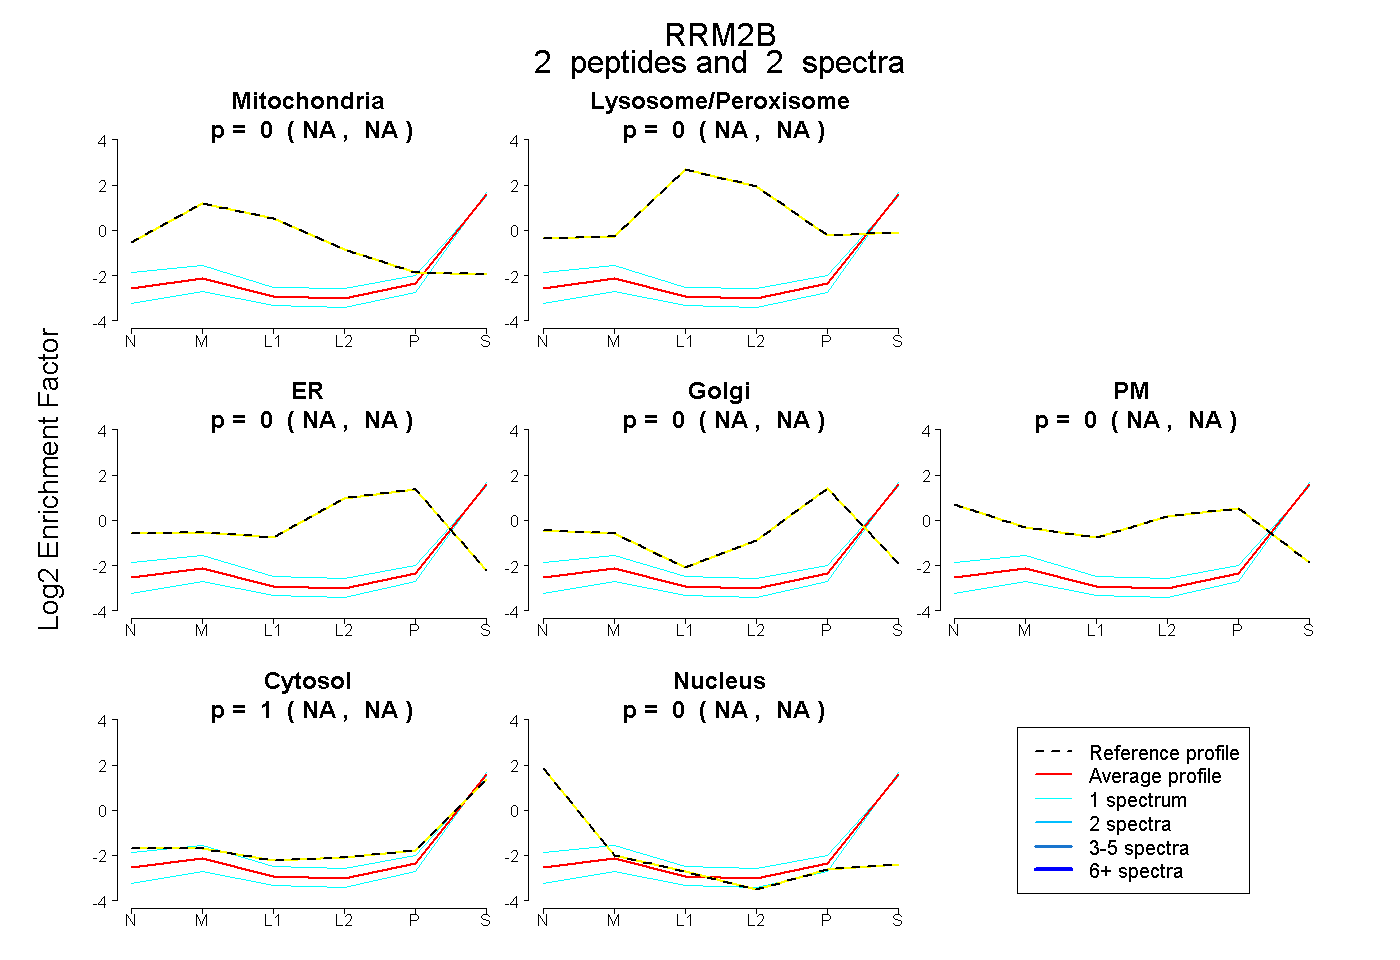 |
0.000 NA | NA |
0.000 NA | NA |
0.000 NA | NA |
0.000 NA | NA |
0.000 NA | NA |
1.000 NA | NA |
0.000 NA | NA |
|||
| Plot | Lyso | Other | |||||||||||
| Expt C |
2 peptides |
11 spectra |
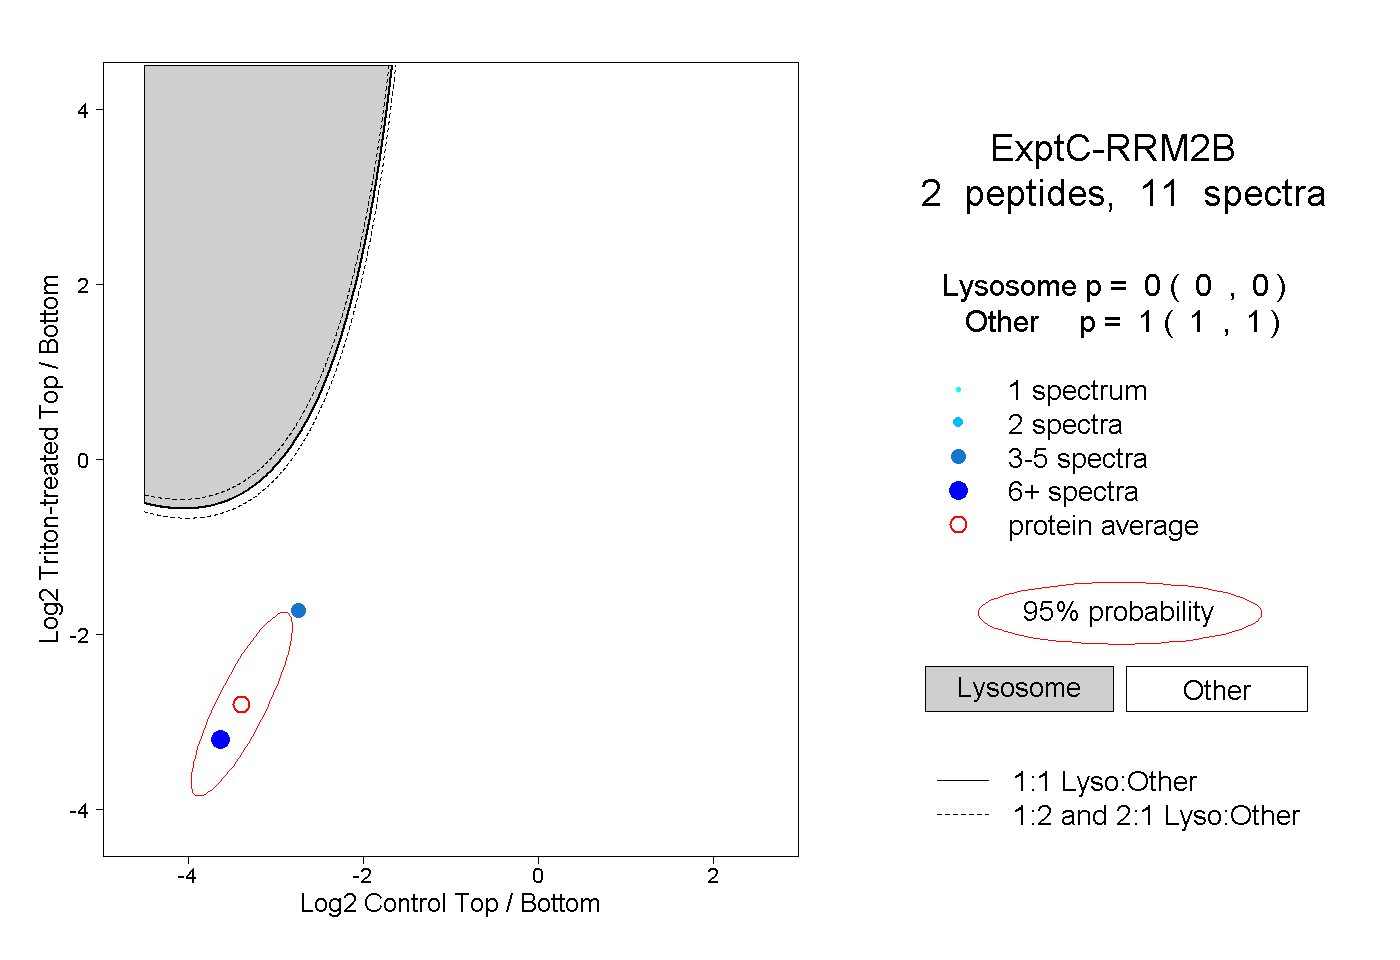 |
0.000 0.000 | 0.000 |
1.000 1.000 | 1.000 |