 4
4peptides
spectra
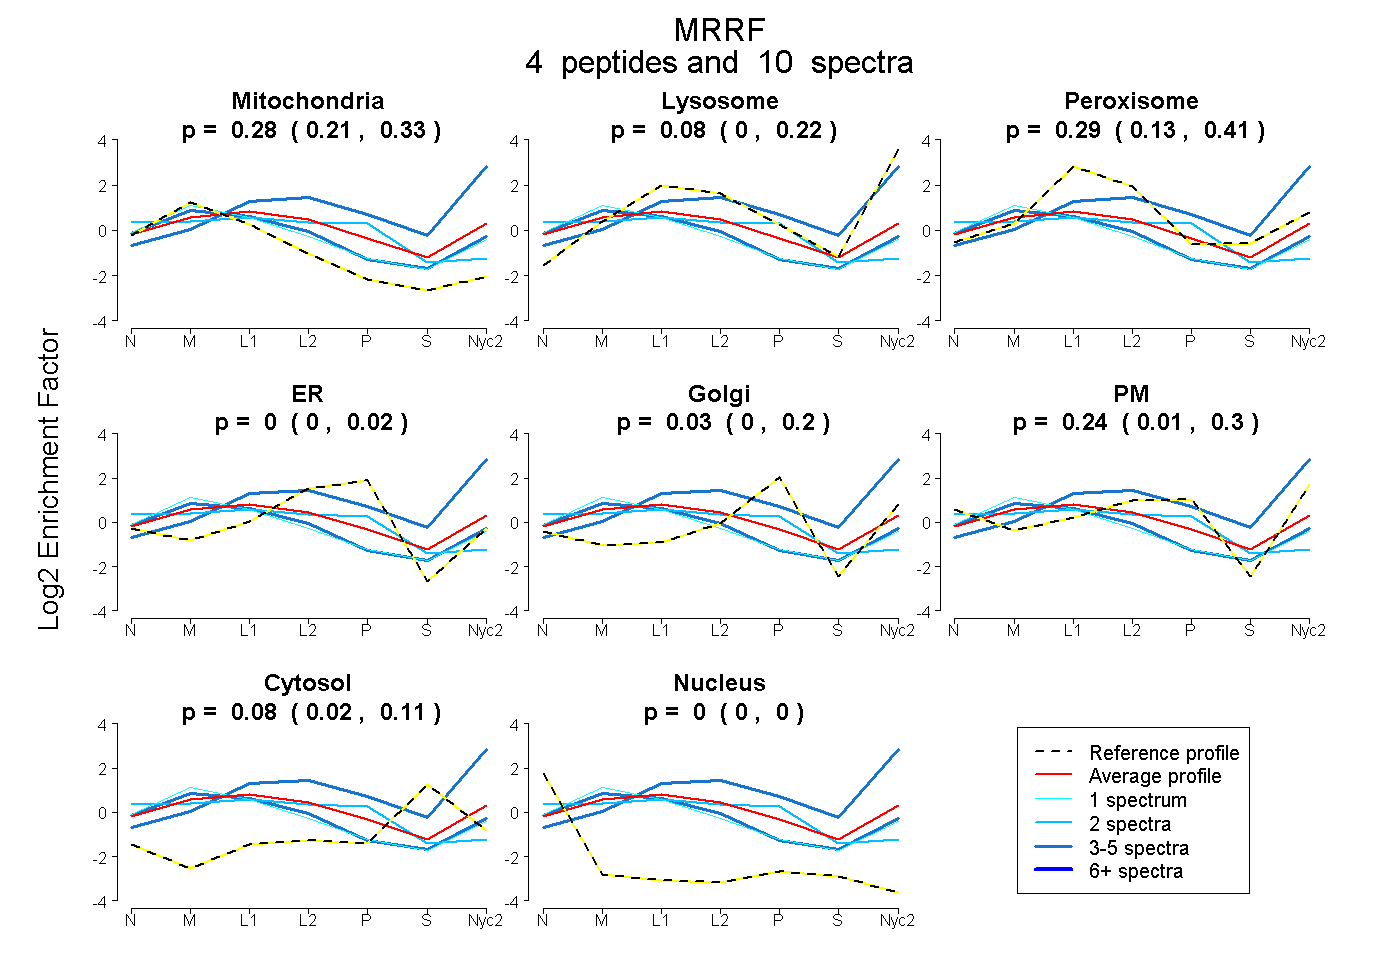
0.211 | 0.334
0.000 | 0.224
0.134 | 0.408
0.000 | 0.023
0.000 | 0.202
0.009 | 0.303
0.019 | 0.112
0.000 | 0.000
7peptides
spectra
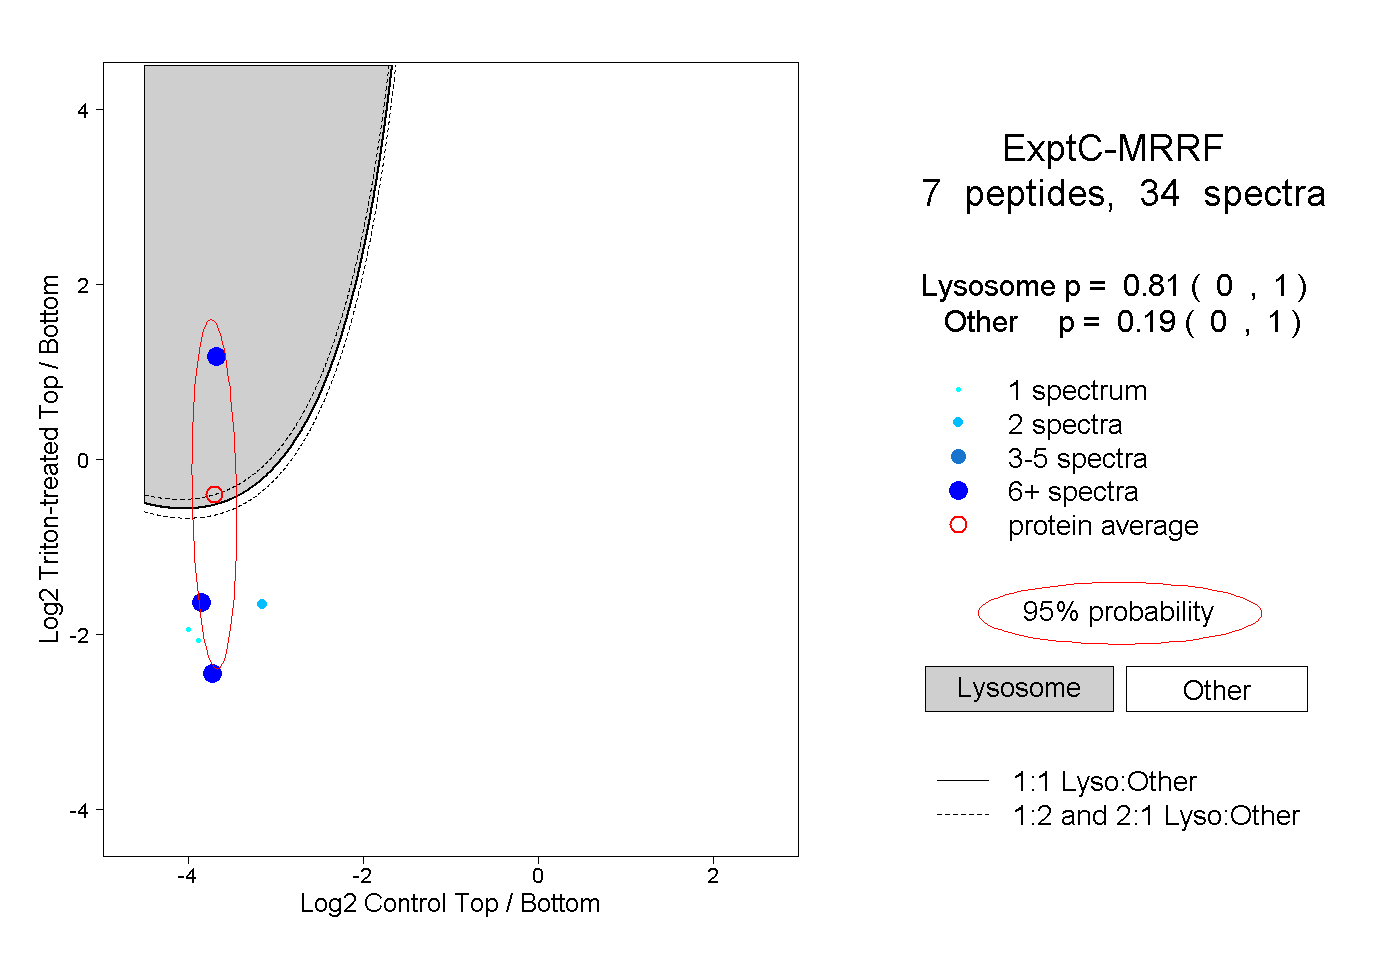
0.000 | 1.000
0.000 | 1.000
2peptides
spectra
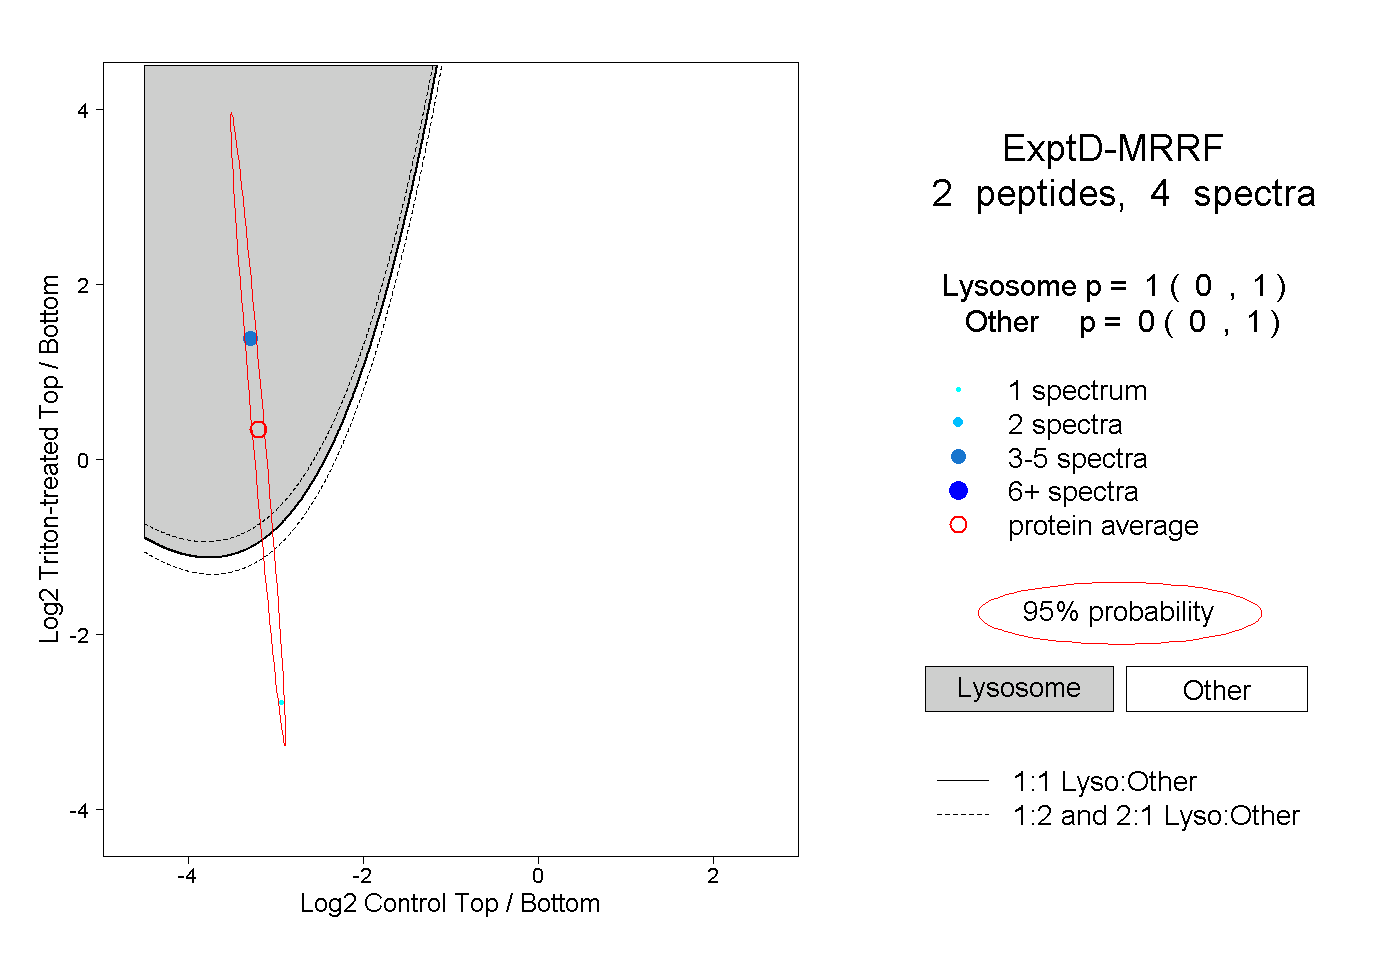
0.000 | 1.000
0.000 | 1.000