 4
4peptides
spectra
0.211 | 0.334
0.000 | 0.224
0.134 | 0.408
0.000 | 0.023
0.000 | 0.202
0.009 | 0.303
0.019 | 0.112
0.000 | 0.000
| Plot | Mito | Lyso | Perox | ER | Golgi | PM | Cytosol | Nucleus | |||||
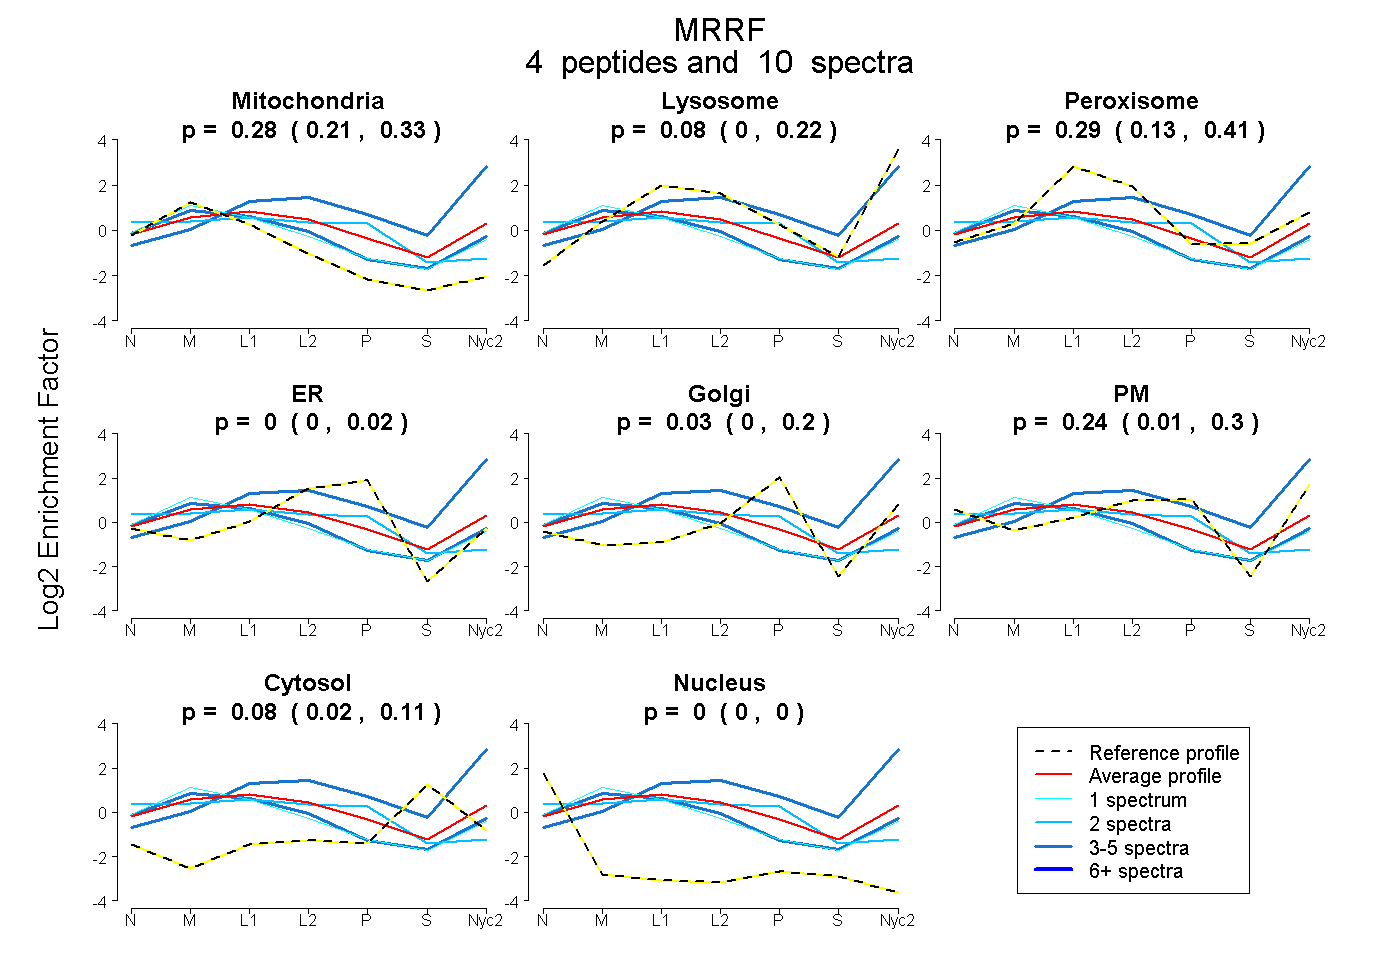
| Expt A |
4 peptides |
10 spectra |
|
0.276 0.211 | 0.334 |
0.080 0.000 | 0.224 |
0.291 0.134 | 0.408 |
0.000 0.000 | 0.023 |
0.034 0.000 | 0.202 |
0.241 0.009 | 0.303 |
0.079 0.019 | 0.112 |
0.000 0.000 | 0.000 |
| 2 spectra, TAPGSLDHITVVTADGK | 0.328 | 0.000 | 0.206 | 0.392 | 0.000 | 0.000 | 0.041 | 0.033 | ||
| 4 spectra, ESGMNLNPEVEGTLIR | 0.552 | 0.124 | 0.149 | 0.000 | 0.000 | 0.126 | 0.049 | 0.000 | ||
| 3 spectra, ALGIR | 0.000 | 0.692 | 0.049 | 0.000 | 0.000 | 0.155 | 0.104 | 0.000 | ||
| 1 spectrum, TNAMNK | 0.614 | 0.131 | 0.106 | 0.000 | 0.000 | 0.119 | 0.031 | 0.000 |
| Plot | Lyso | Other | |||||||||||
| Expt C |
7 peptides |
34 spectra |
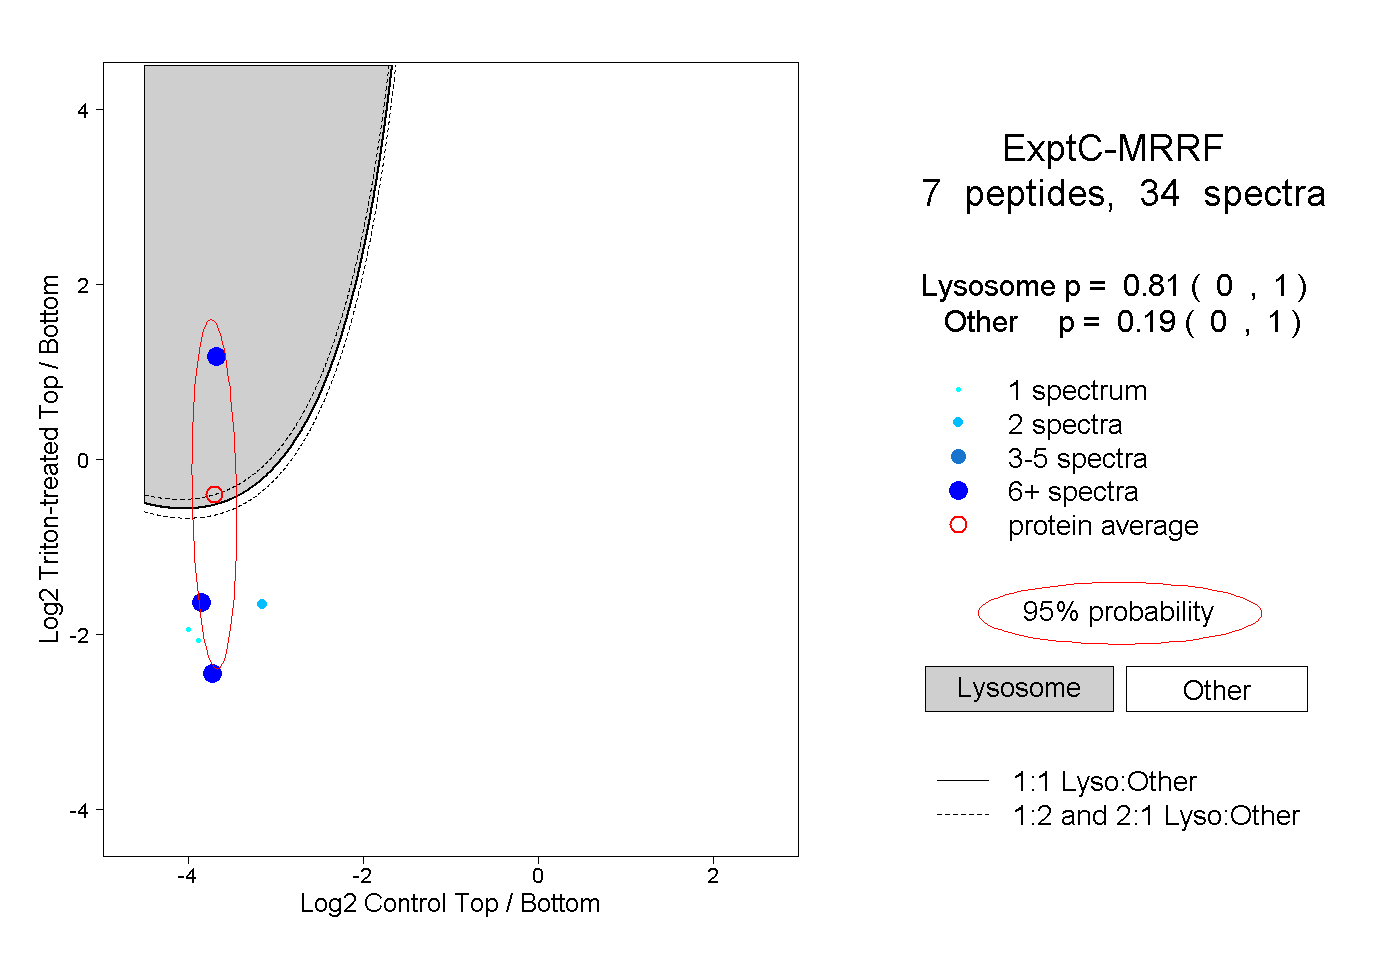 |
0.810 0.000 | 1.000 |
0.190 0.000 | 1.000 |
||||||||
| Plot | Lyso | Other | |||||||||||
| Expt D |
2 peptides |
4 spectra |
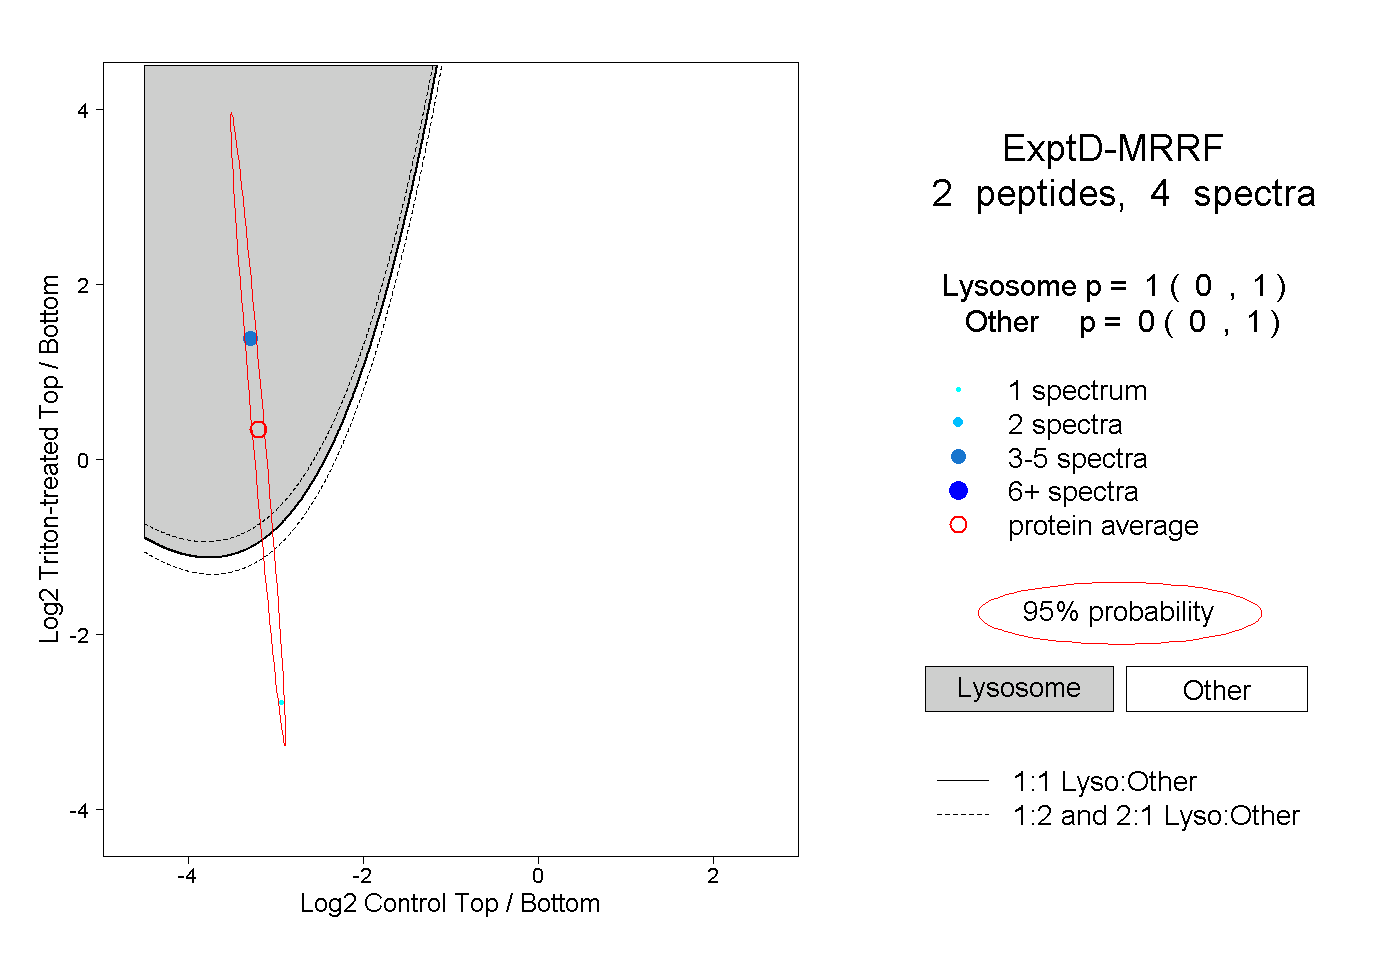 |
1.000 0.000 | 1.000 |
0.000 0.000 | 1.000 |