 8
8peptides
spectra
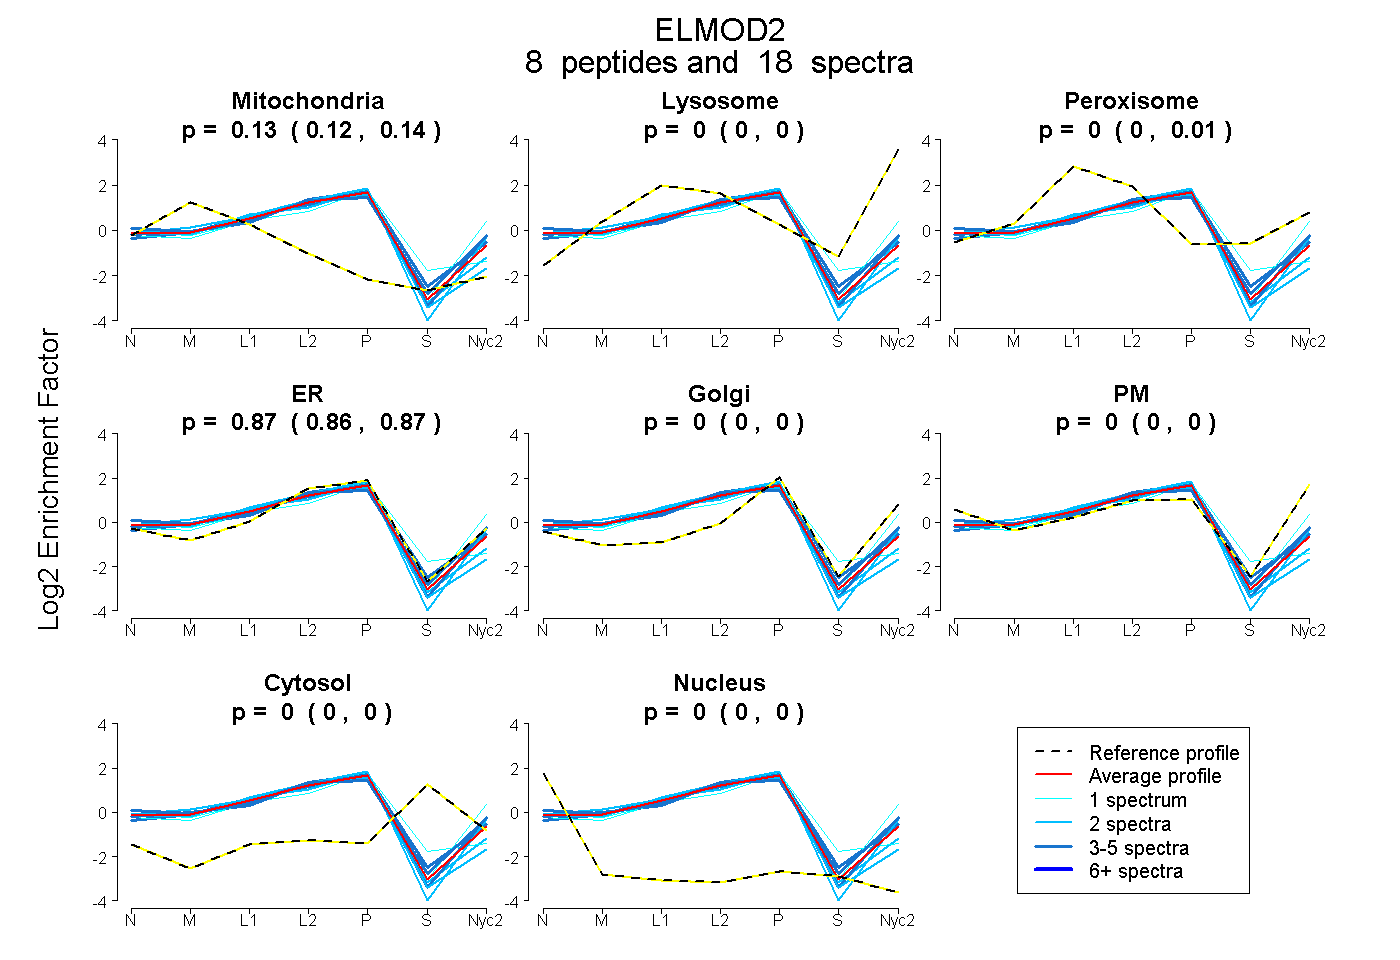
0.122 | 0.139
0.000 | 0.000
0.000 | 0.010
0.858 | 0.872
0.000 | 0.000
0.000 | 0.000
0.000 | 0.000
0.000 | 0.000
2peptides
spectra
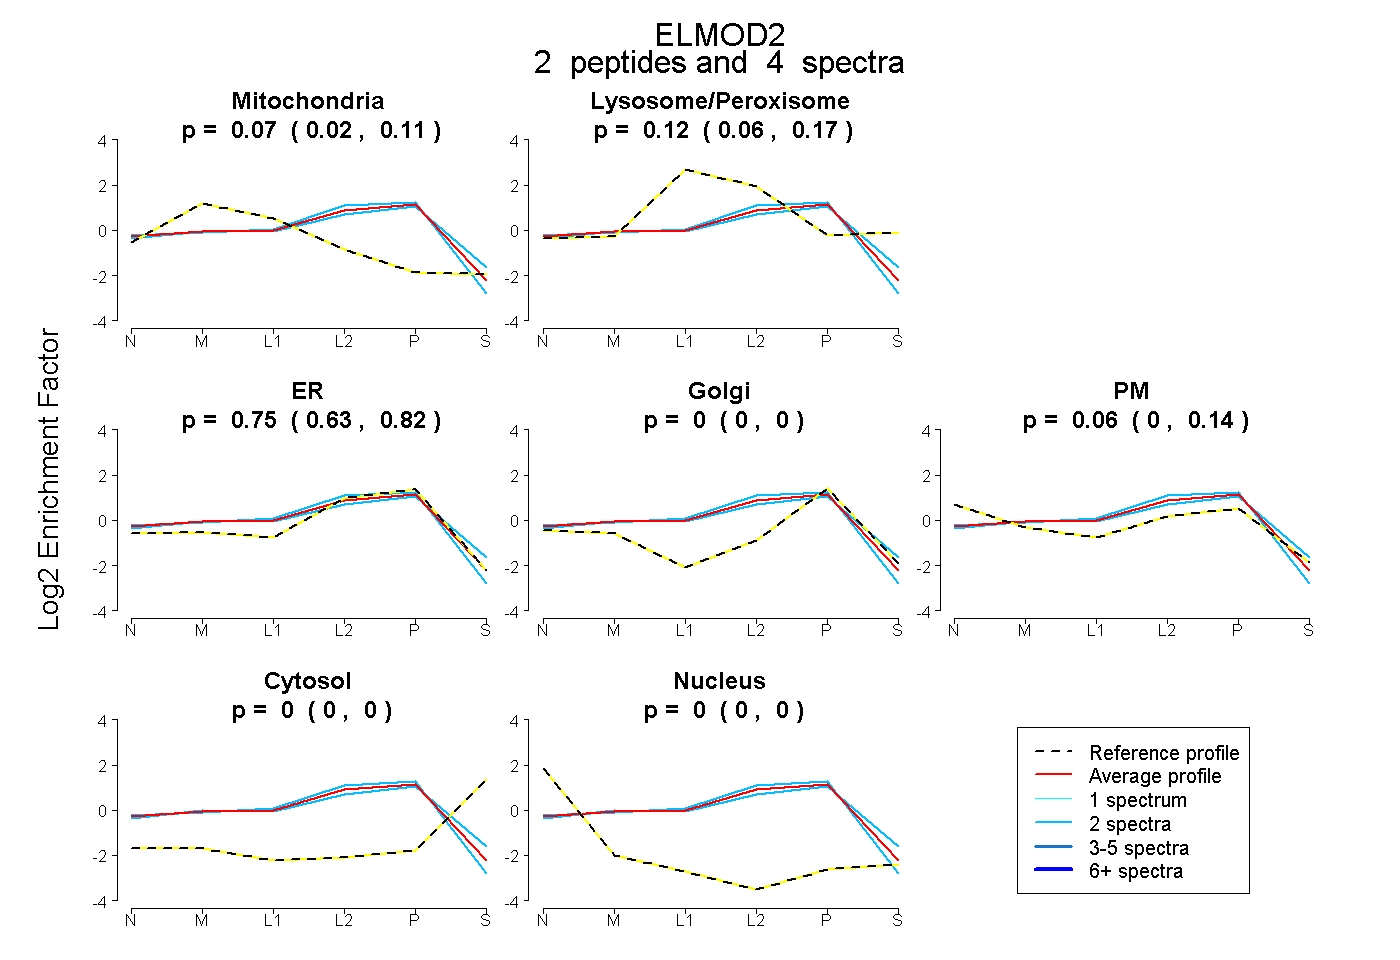
0.019 | 0.108
0.059 | 0.170
0.631 | 0.823
0.000 | 0.000
0.000 | 0.135
0.000 | 0.000
0.000 | 0.000
8peptides
spectra
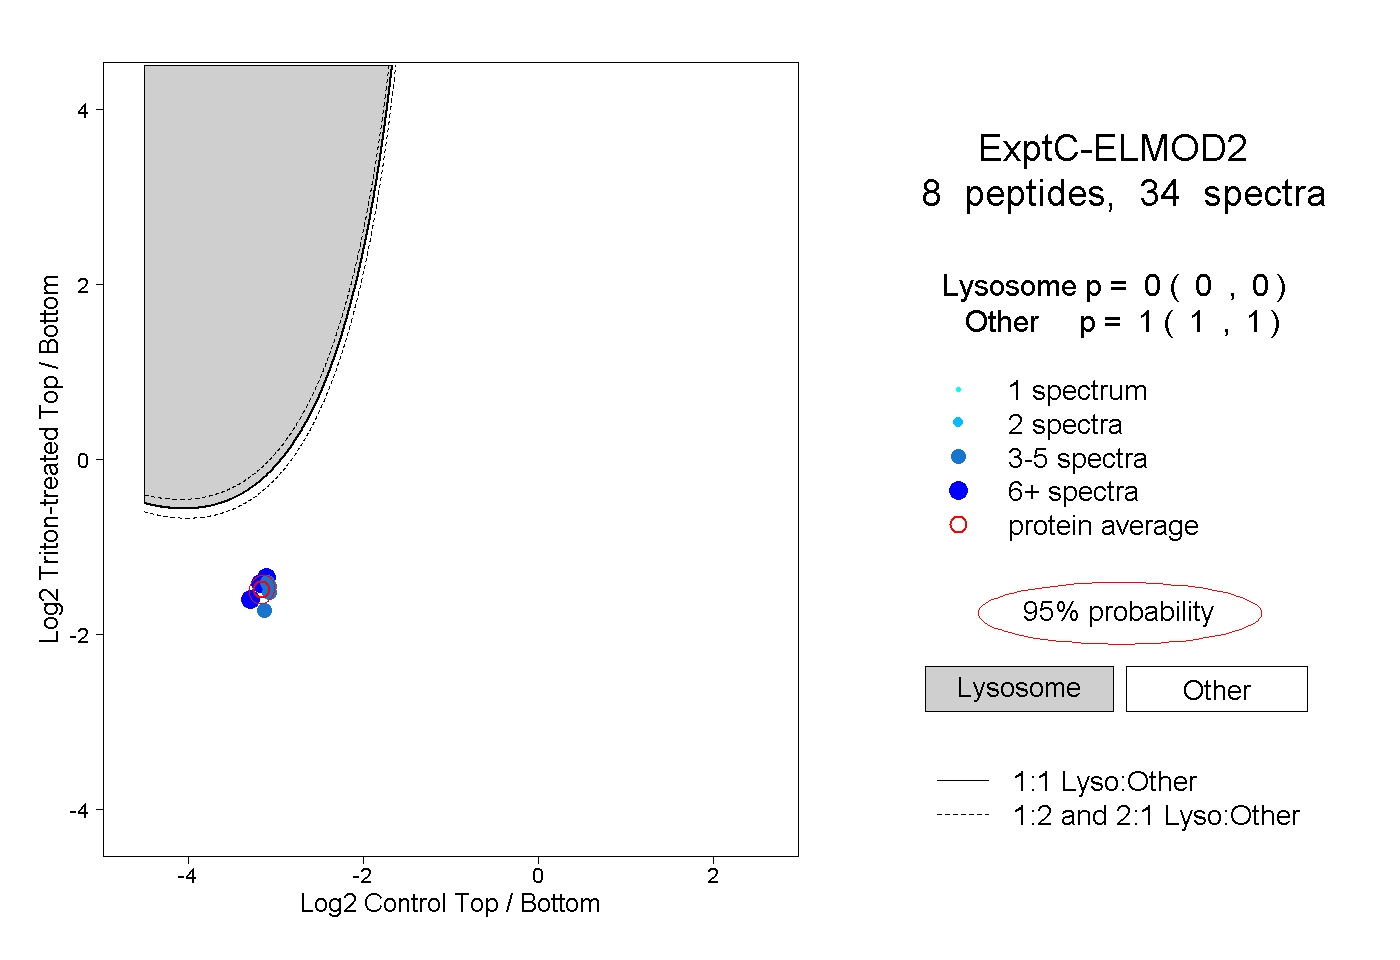
0.000 | 0.000
1.000 | 1.000
3peptides
spectra
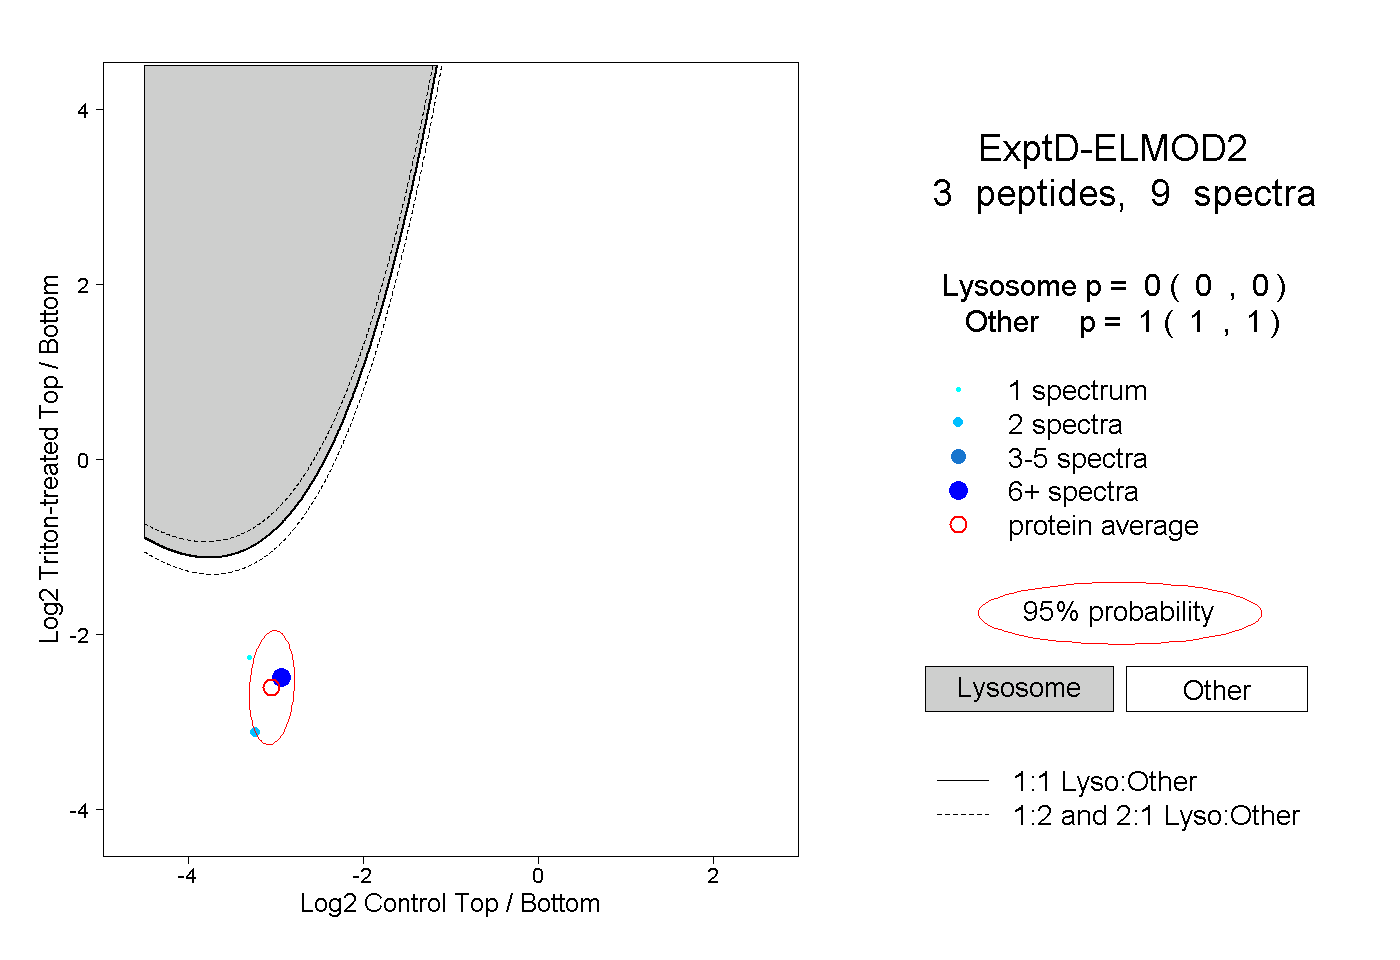
0.000 | 0.000
1.000 | 1.000