 8
8peptides
spectra
0.122 | 0.139
0.000 | 0.000
0.000 | 0.010
0.858 | 0.872
0.000 | 0.000
0.000 | 0.000
0.000 | 0.000
0.000 | 0.000
| Plot | Mito | Lyso | Perox | ER | Golgi | PM | Cytosol | Nucleus | |||||
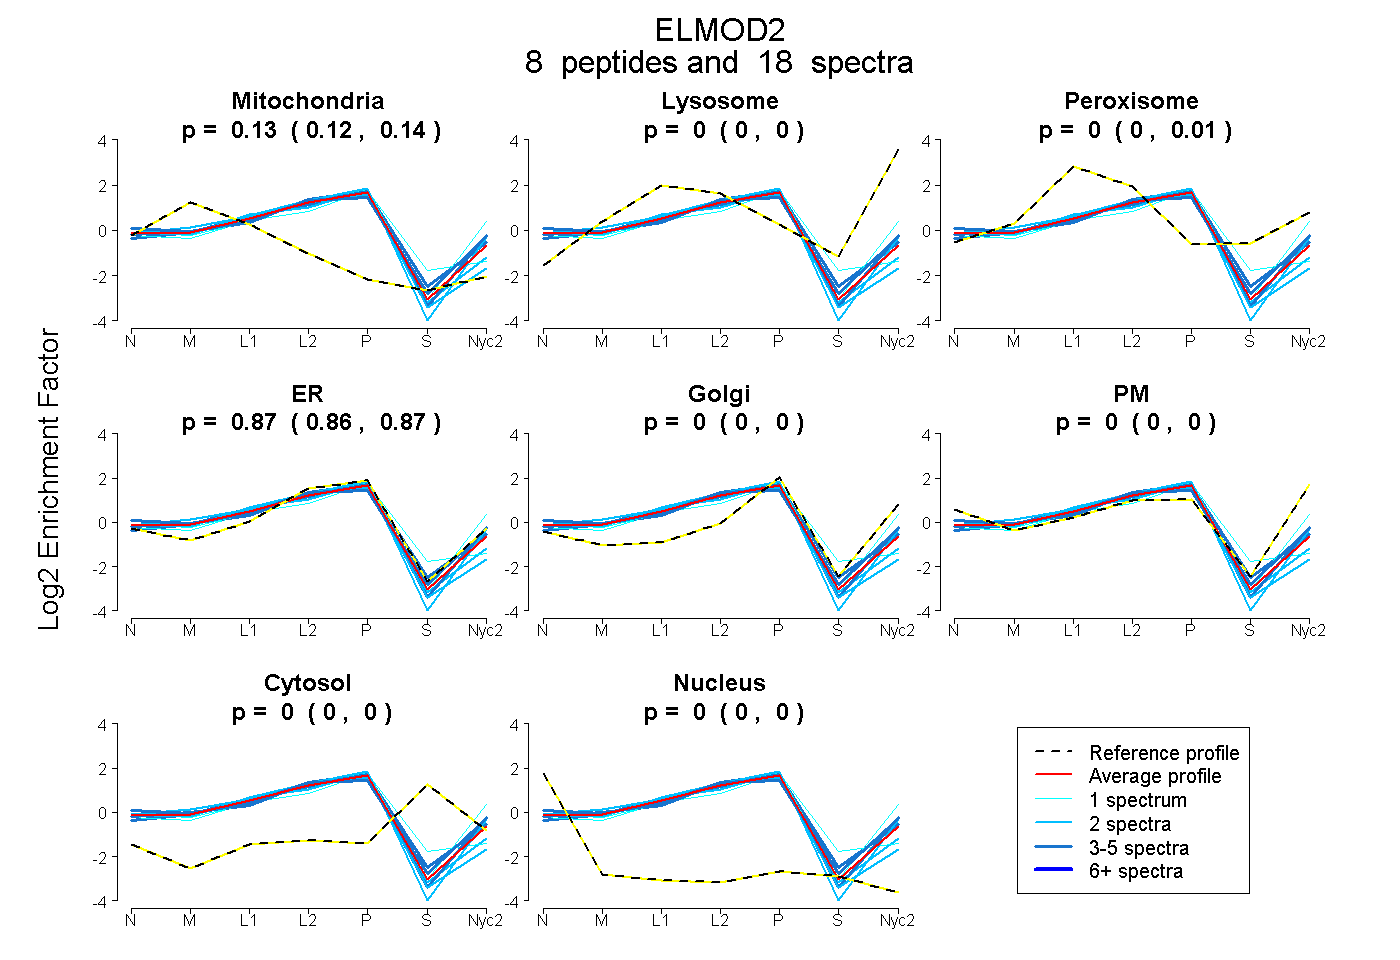
| Expt A |
8 peptides |
18 spectra |
|
0.133 0.122 | 0.139 |
0.000 0.000 | 0.000 |
0.000 0.000 | 0.010 |
0.867 0.858 | 0.872 |
0.000 0.000 | 0.000 |
0.000 0.000 | 0.000 |
0.000 0.000 | 0.000 |
0.000 0.000 | 0.000 |
| 1 spectrum, QWADIGFQGDDPK | 0.017 | 0.022 | 0.000 | 0.682 | 0.000 | 0.279 | 0.000 | 0.000 | ||
| 3 spectra, CIVDIMK | 0.100 | 0.000 | 0.089 | 0.811 | 0.000 | 0.000 | 0.000 | 0.000 | ||
| 1 spectrum, GLLMDCNAVLTLK | 0.135 | 0.000 | 0.019 | 0.781 | 0.000 | 0.000 | 0.064 | 0.000 | ||
| 3 spectra, IFDTYGGAQR | 0.085 | 0.000 | 0.000 | 0.839 | 0.000 | 0.076 | 0.000 | 0.000 | ||
| 2 spectra, DSSFQICMR | 0.158 | 0.000 | 0.000 | 0.842 | 0.000 | 0.000 | 0.000 | 0.000 | ||
| 4 spectra, VLQNATR | 0.112 | 0.000 | 0.037 | 0.731 | 0.000 | 0.120 | 0.000 | 0.000 | ||
| 2 spectra, VAESDLDR | 0.074 | 0.000 | 0.000 | 0.895 | 0.000 | 0.031 | 0.000 | 0.000 | ||
| 2 spectra, TCLLQITGYR | 0.219 | 0.000 | 0.000 | 0.781 | 0.000 | 0.000 | 0.000 | 0.000 |
| Plot | Mito | Lyso or Perox | ER | Golgi | PM | Cytosol | Nucleus | ||||||
| Expt B |
2 peptides |
4 spectra |
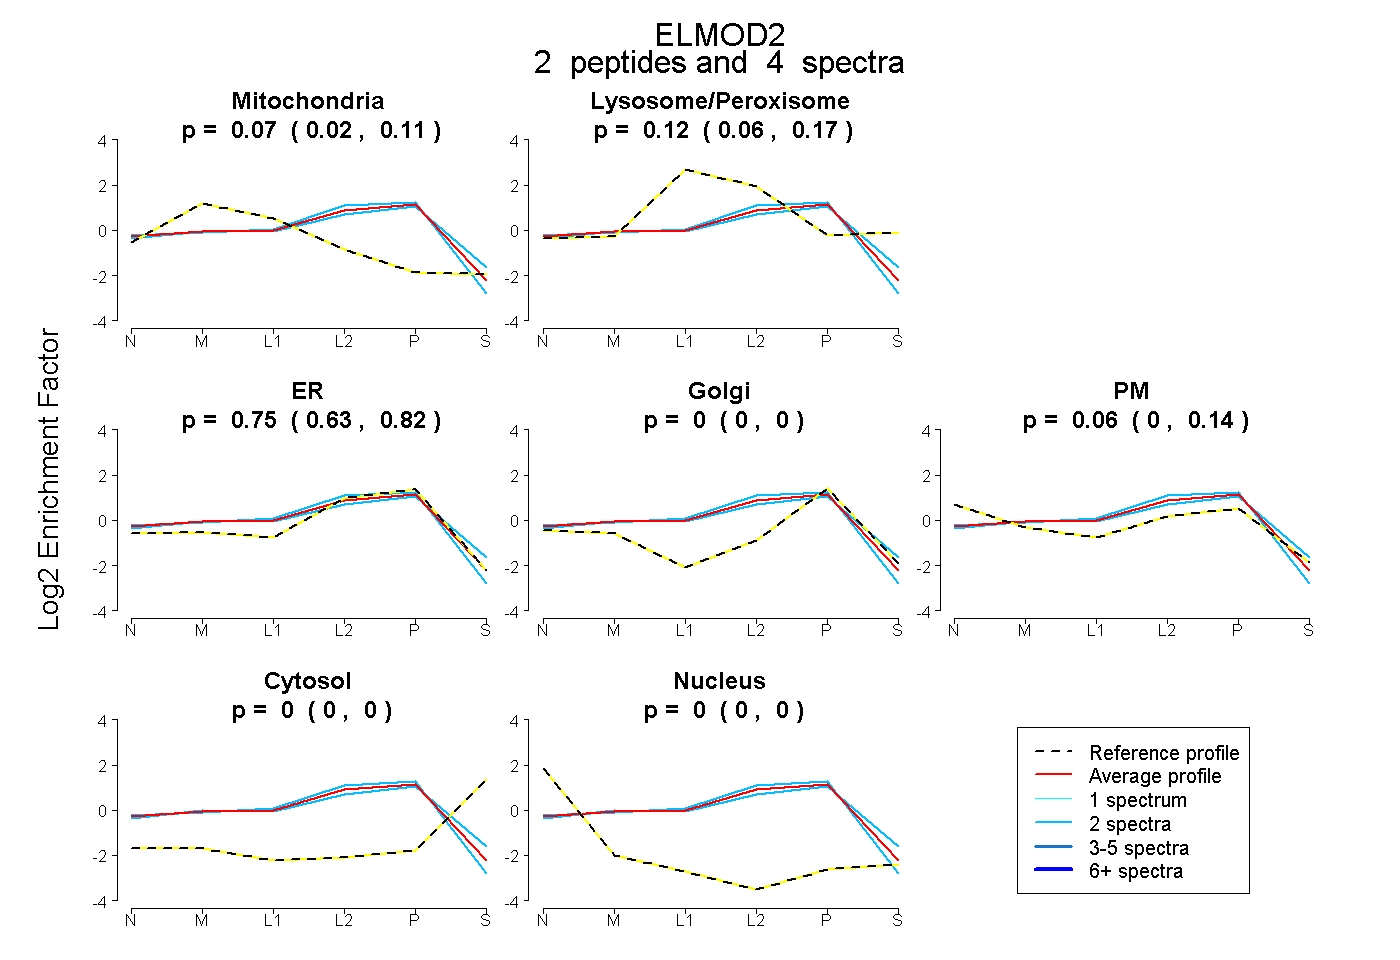 |
0.069 0.019 | 0.108 |
0.119 0.059 | 0.170 |
0.746 0.631 | 0.823 |
0.000 0.000 | 0.000 |
0.065 0.000 | 0.135 |
0.000 0.000 | 0.000 |
0.000 0.000 | 0.000 |
|||
| Plot | Lyso | Other | |||||||||||
| Expt C |
8 peptides |
34 spectra |
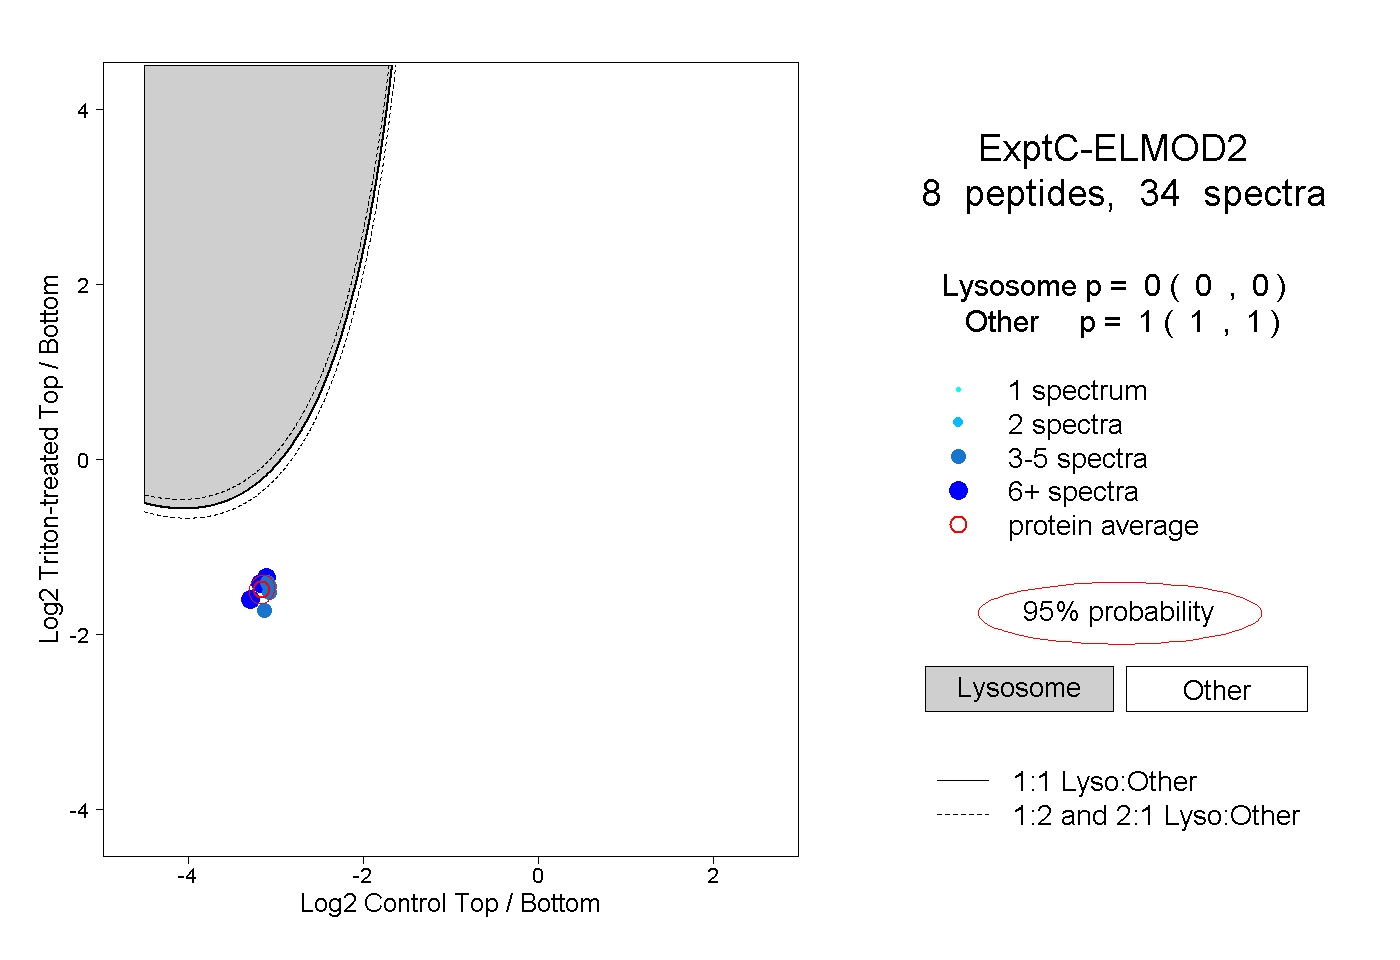 |
0.000 0.000 | 0.000 |
1.000 1.000 | 1.000 |
||||||||
| Plot | Lyso | Other | |||||||||||
| Expt D |
3 peptides |
9 spectra |
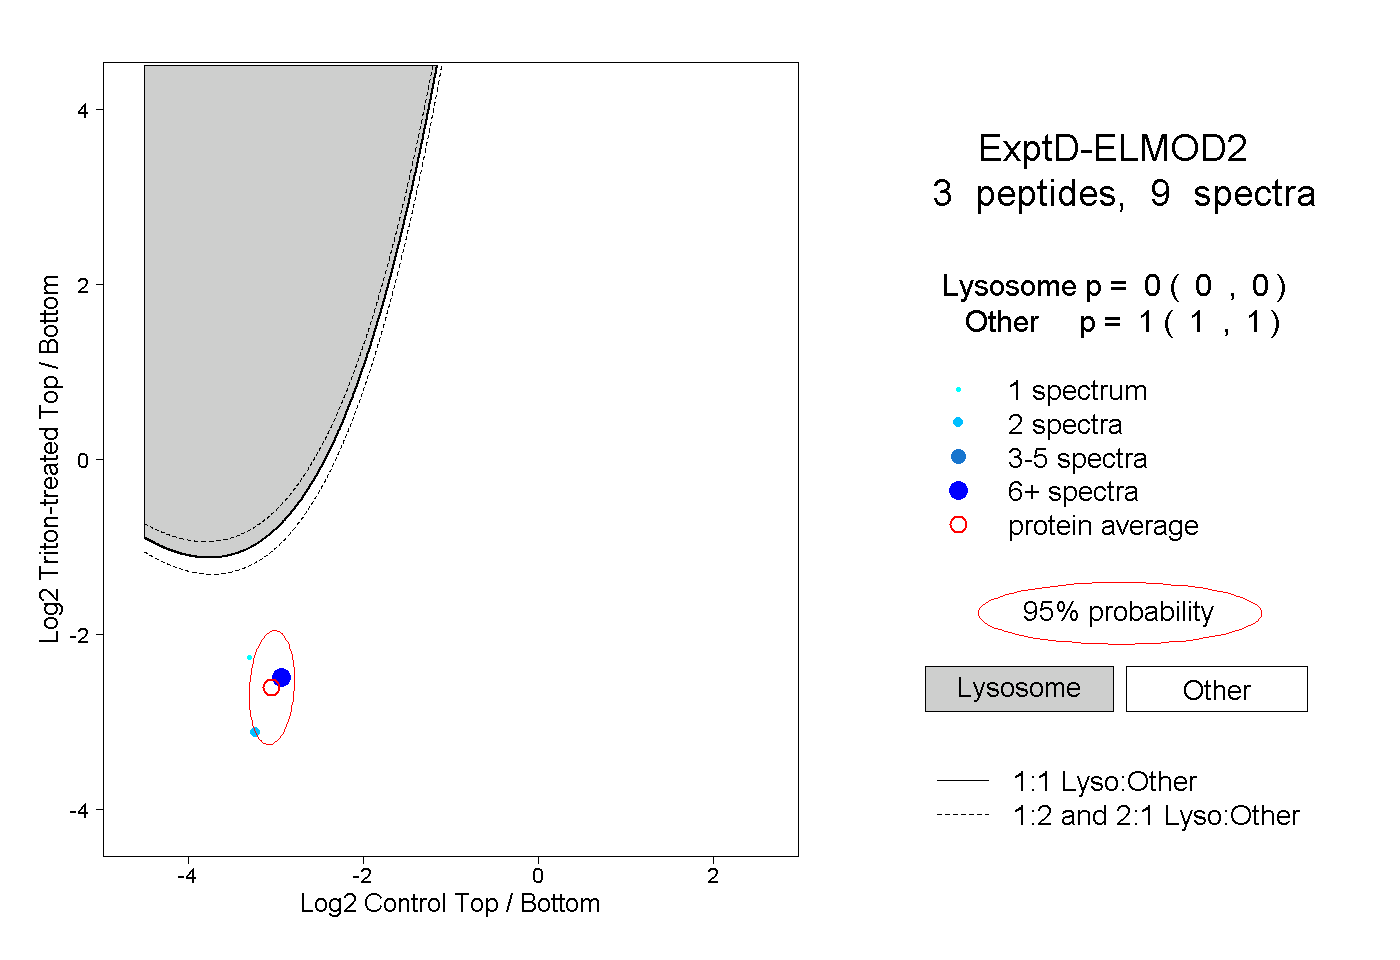 |
0.000 0.000 | 0.000 |
1.000 1.000 | 1.000 |