 4
4peptides
spectra
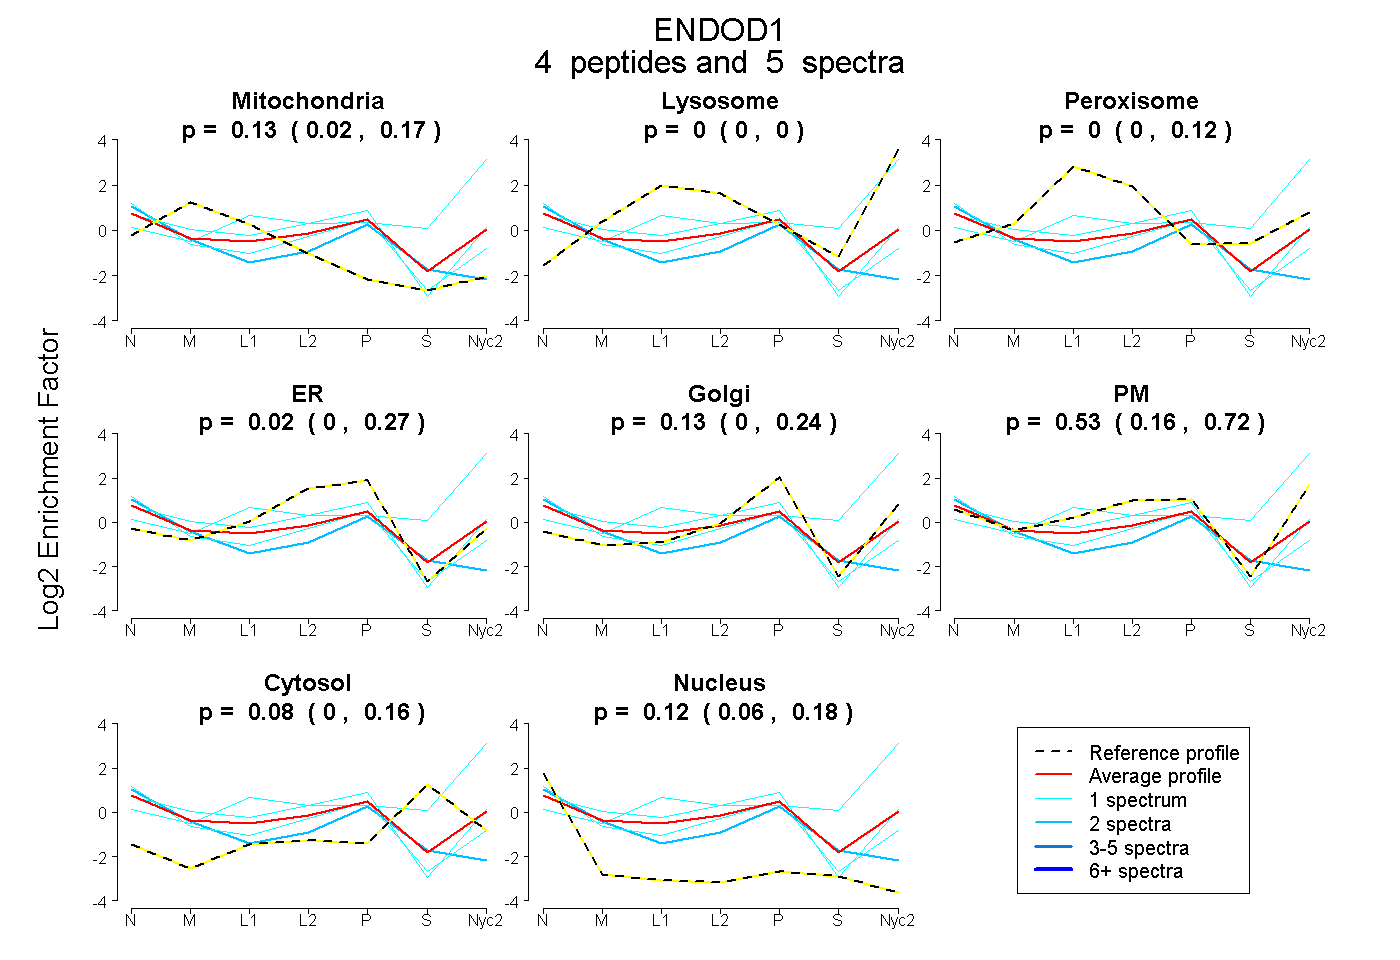
0.016 | 0.173
0.000 | 0.000
0.000 | 0.121
0.000 | 0.268
0.000 | 0.245
0.161 | 0.724
0.000 | 0.164
0.059 | 0.185
1peptide
spectrum
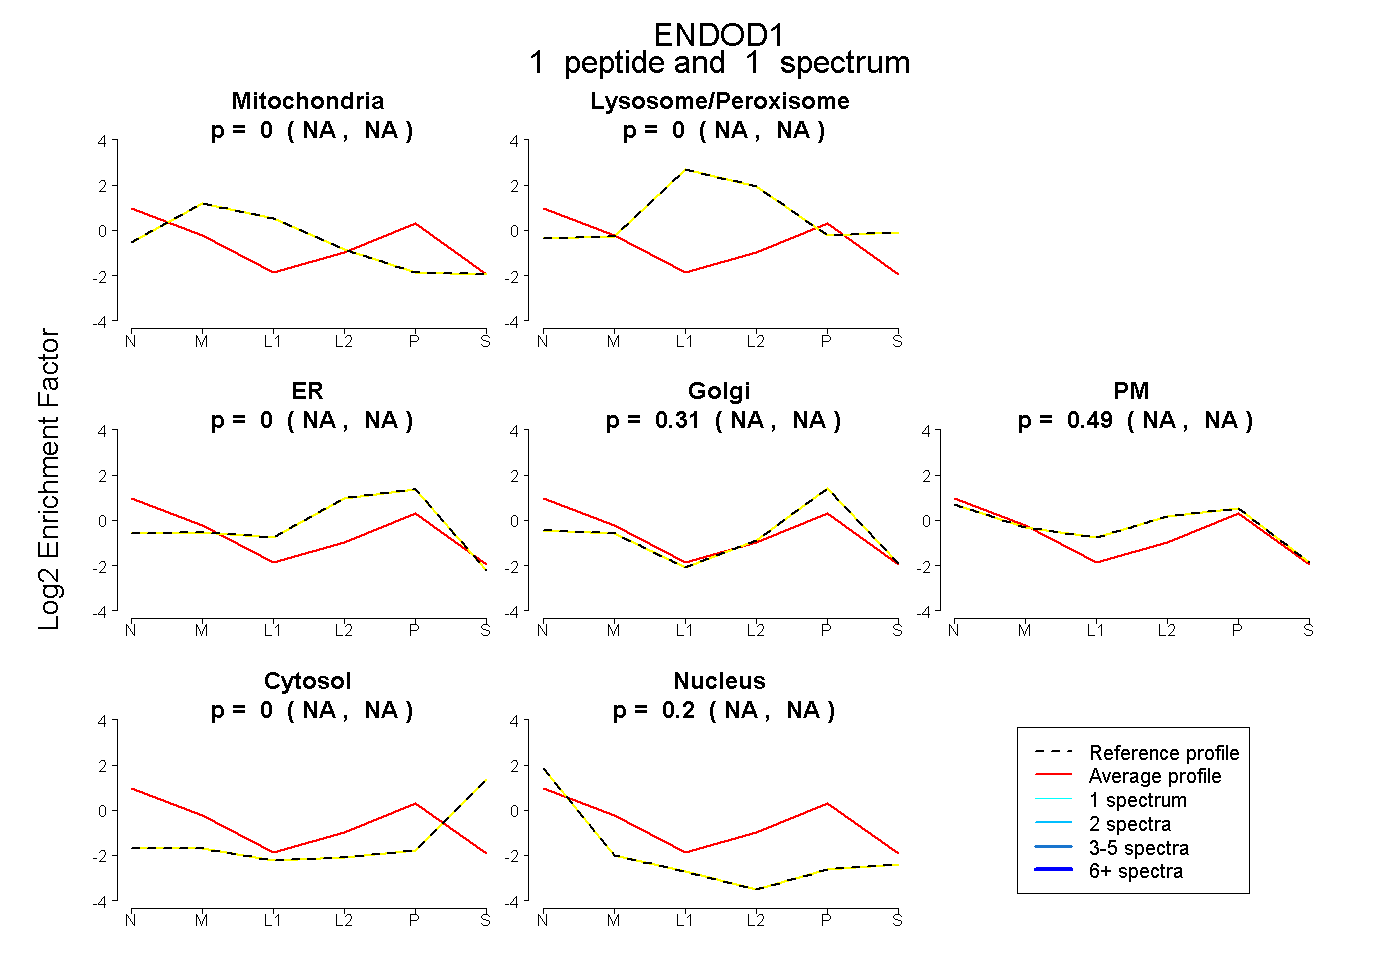
NA | NA
NA | NA
NA | NA
NA | NA
NA | NA
NA | NA
NA | NA
1peptide
spectra
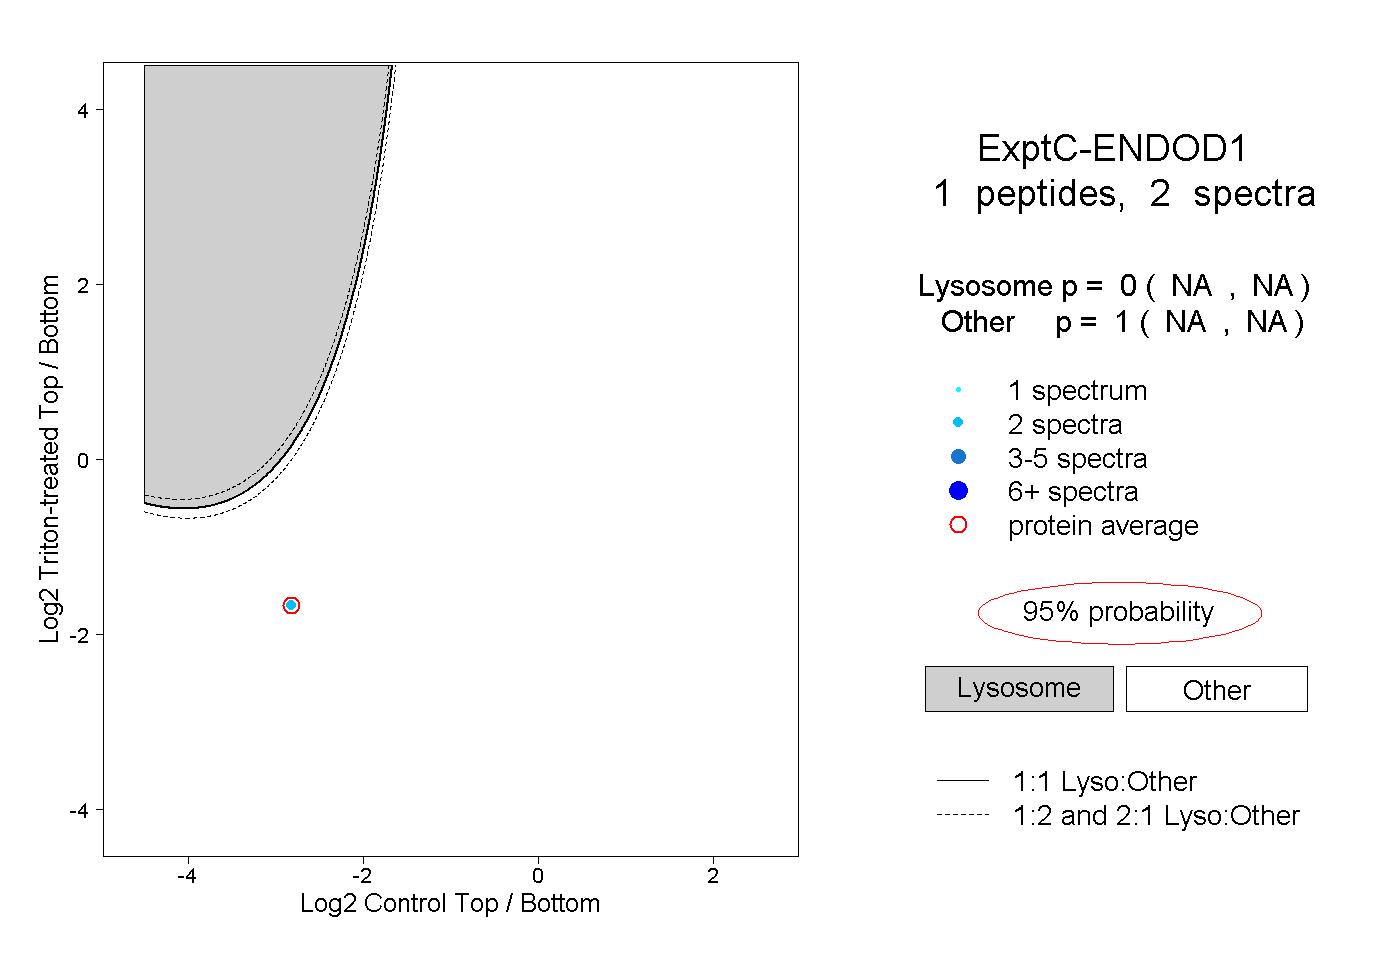
NA | NA
NA | NA