 4
4peptides
spectra
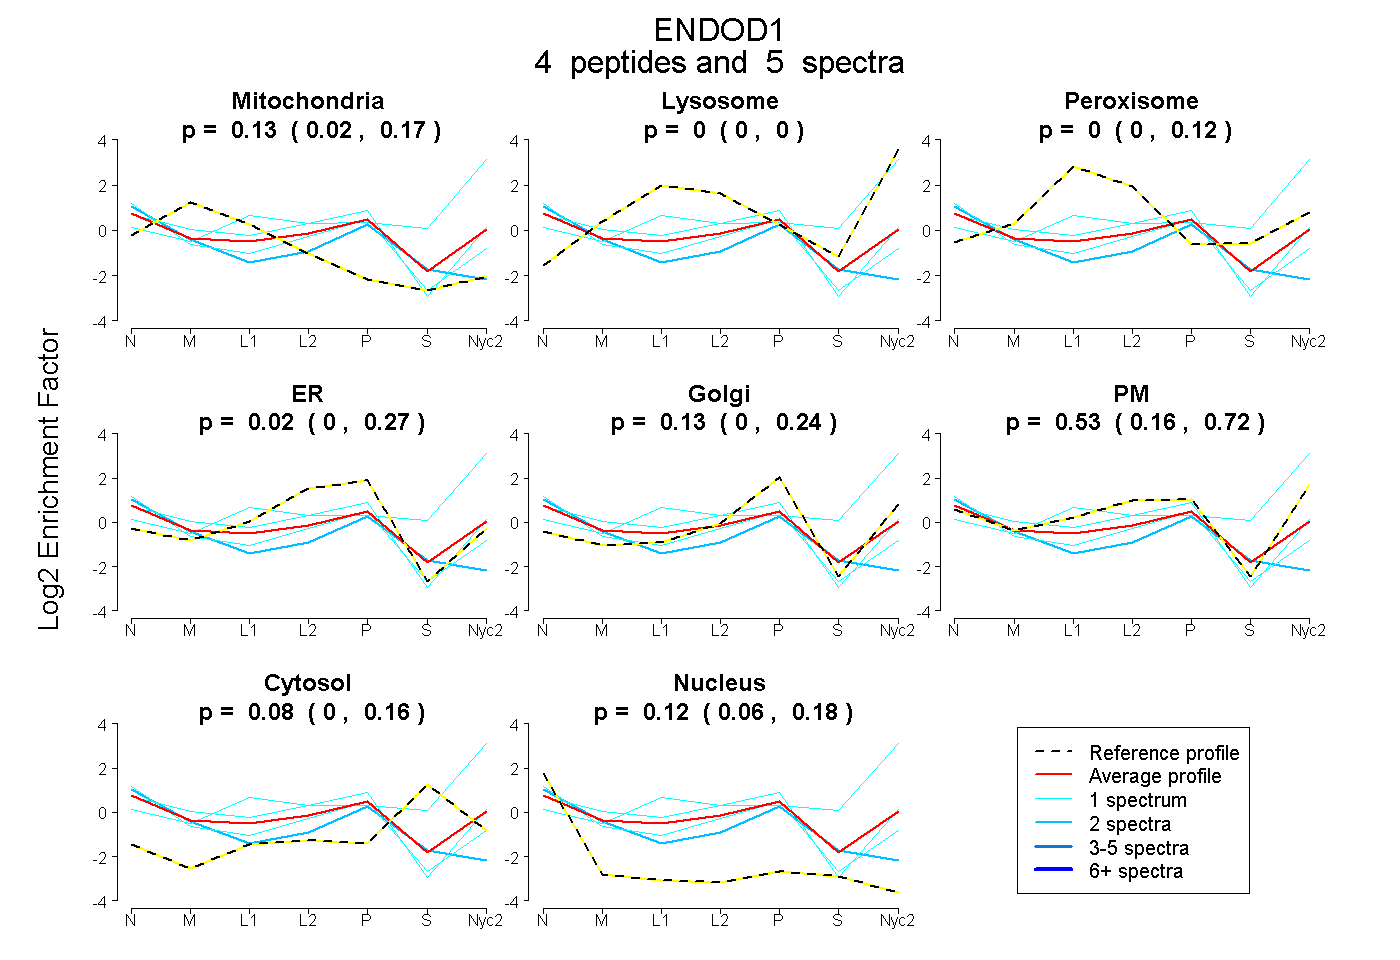
0.016 | 0.173
0.000 | 0.000
0.000 | 0.121
0.000 | 0.268
0.000 | 0.245
0.161 | 0.724
0.000 | 0.164
0.059 | 0.185
| Plot | Mito | Lyso | Perox | ER | Golgi | PM | Cytosol | Nucleus | |||||
| Expt A |
4 peptides |
5 spectra |
|
0.127 0.016 | 0.173 |
0.000 0.000 | 0.000 |
0.000 0.000 | 0.121 |
0.018 0.000 | 0.268 |
0.131 0.000 | 0.245 |
0.531 0.161 | 0.724 |
0.078 0.000 | 0.164 |
0.116 0.059 | 0.185 |
| 1 spectrum, IPVFSAFR | 0.048 | 0.000 | 0.000 | 0.279 | 0.027 | 0.355 | 0.000 | 0.292 | ||
| 2 spectra, ALSIPLR | 0.186 | 0.000 | 0.000 | 0.345 | 0.101 | 0.000 | 0.038 | 0.329 | ||
| 1 spectrum, SLQSQENMSPLASTR | 0.000 | 0.532 | 0.000 | 0.000 | 0.000 | 0.248 | 0.220 | 0.000 | ||
| 1 spectrum, HTQDSDVIEDVMVR | 0.169 | 0.000 | 0.000 | 0.208 | 0.078 | 0.485 | 0.000 | 0.060 |
| Plot | Mito | Lyso or Perox | ER | Golgi | PM | Cytosol | Nucleus | ||||||
| Expt B |
1 peptide |
1 spectrum |
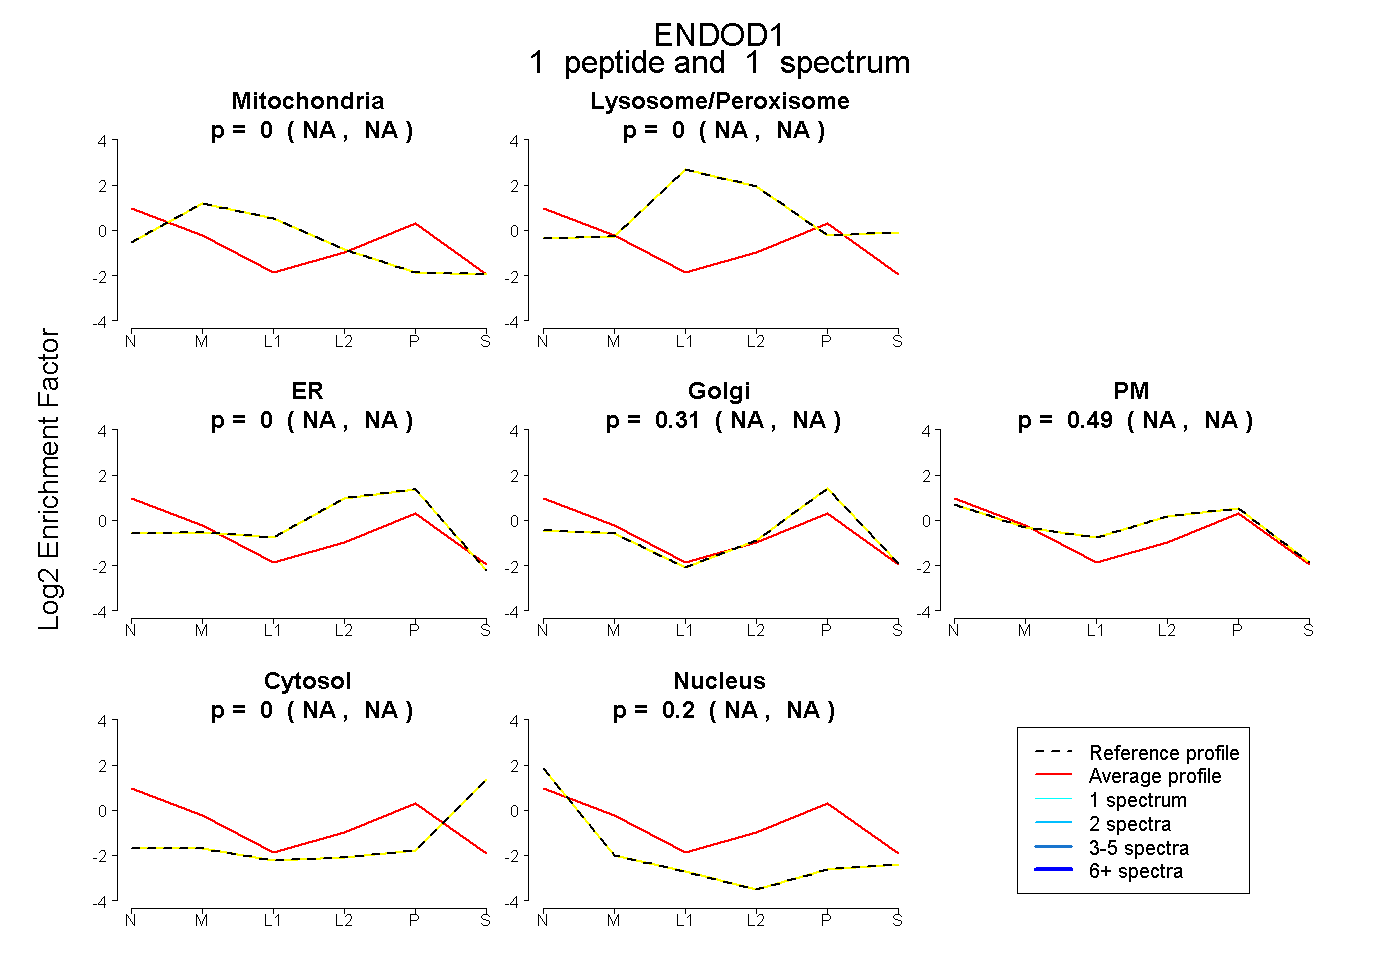 |
0.000 NA | NA |
0.000 NA | NA |
0.000 NA | NA |
0.306 NA | NA |
0.493 NA | NA |
0.000 NA | NA |
0.201 NA | NA |
|||
| Plot | Lyso | Other | |||||||||||
| Expt C |
1 peptide |
2 spectra |
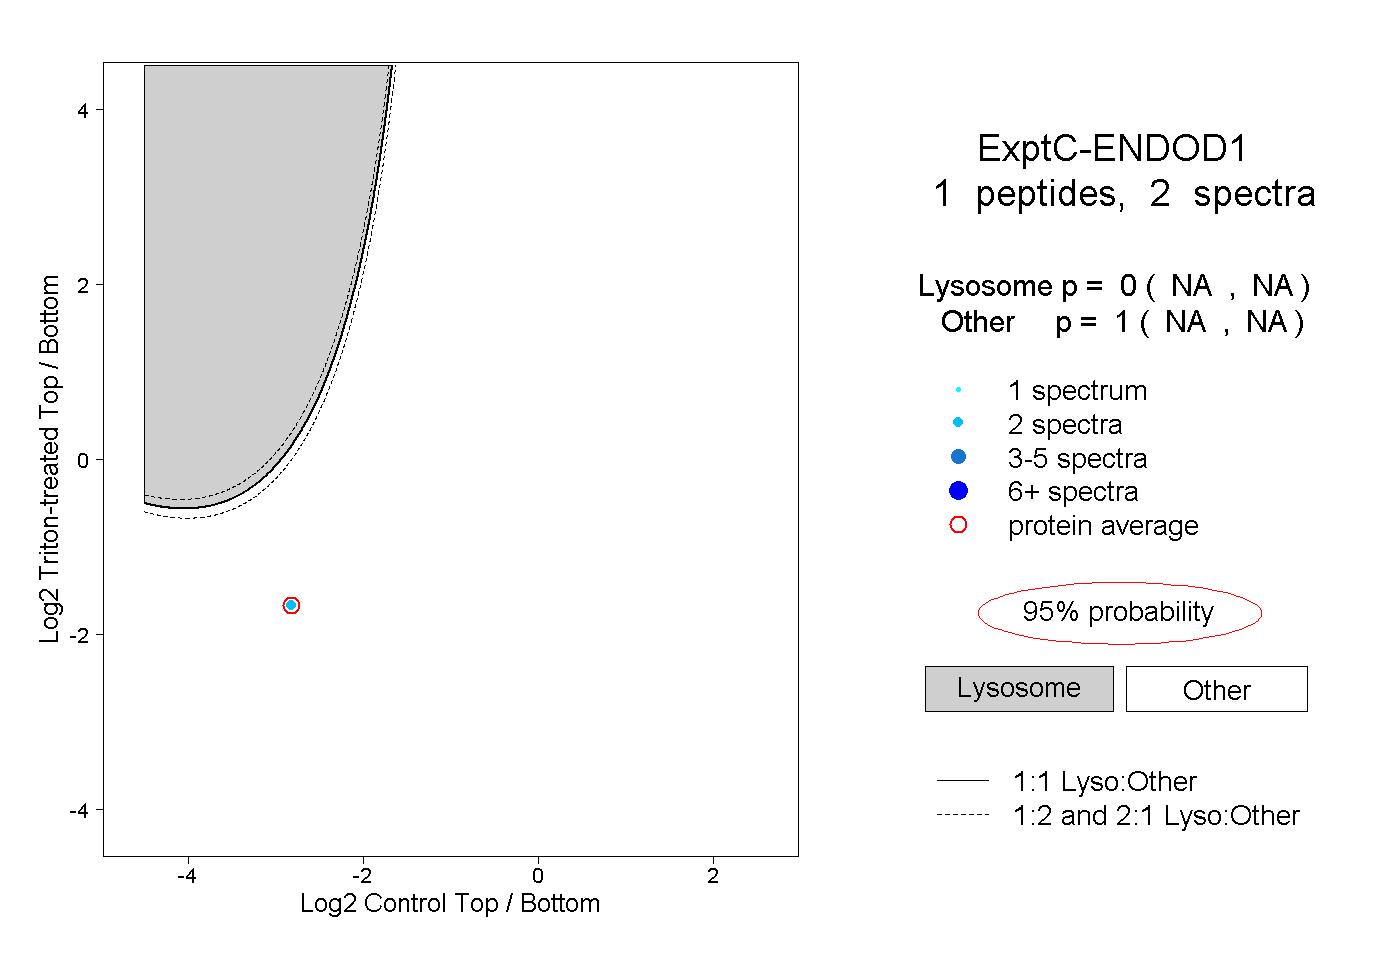 |
0.000 NA | NA |
1.000 NA | NA |