 3
3peptides
spectra
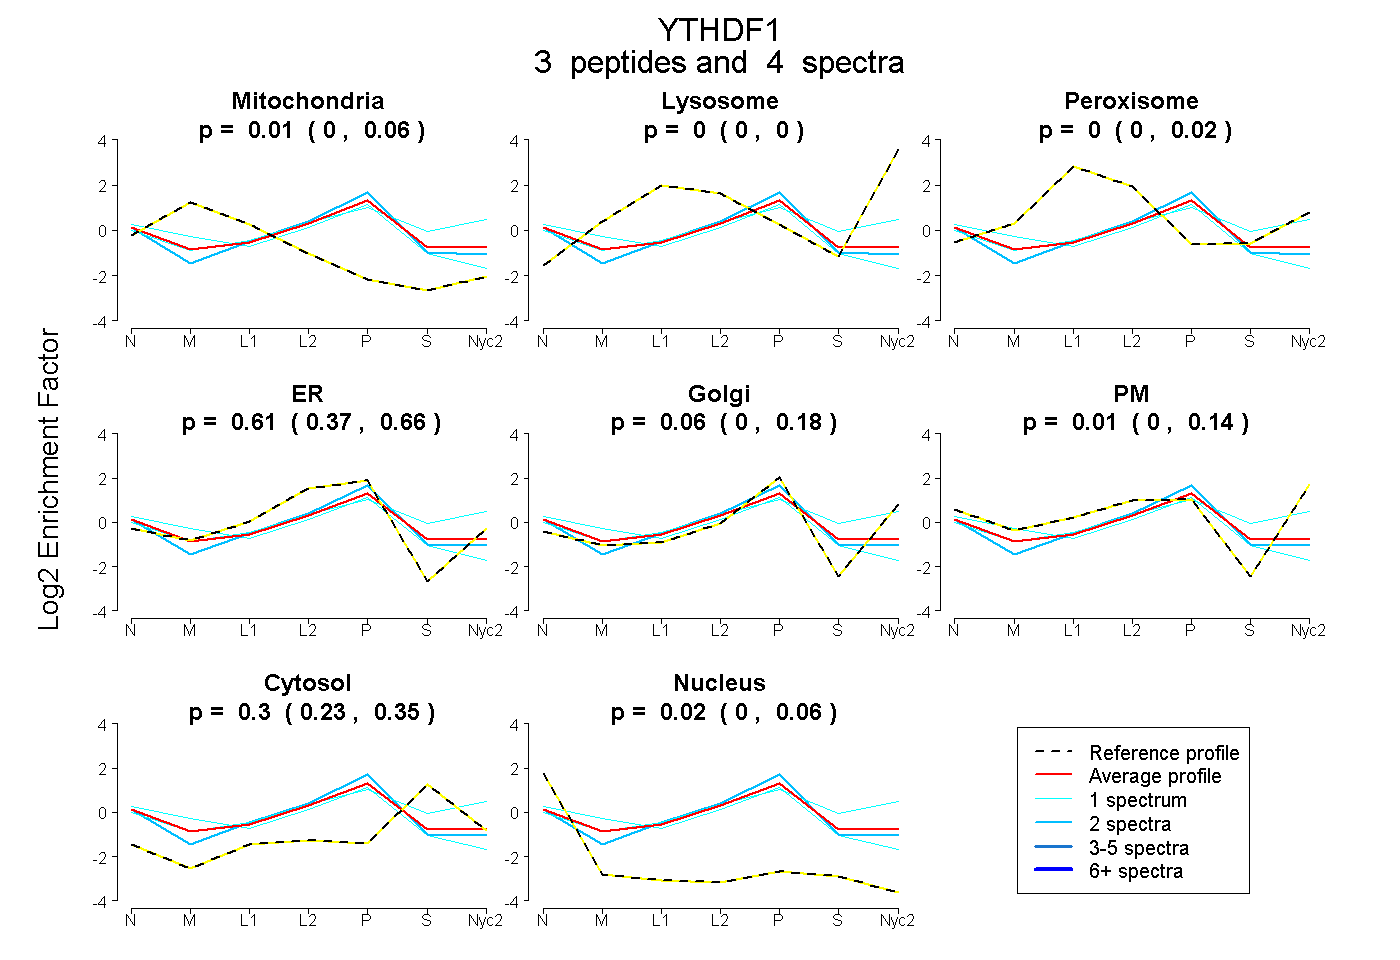
0.000 | 0.058
0.000 | 0.000
0.000 | 0.019
0.367 | 0.659
0.000 | 0.183
0.000 | 0.144
0.231 | 0.350
0.000 | 0.061
3peptides
spectra
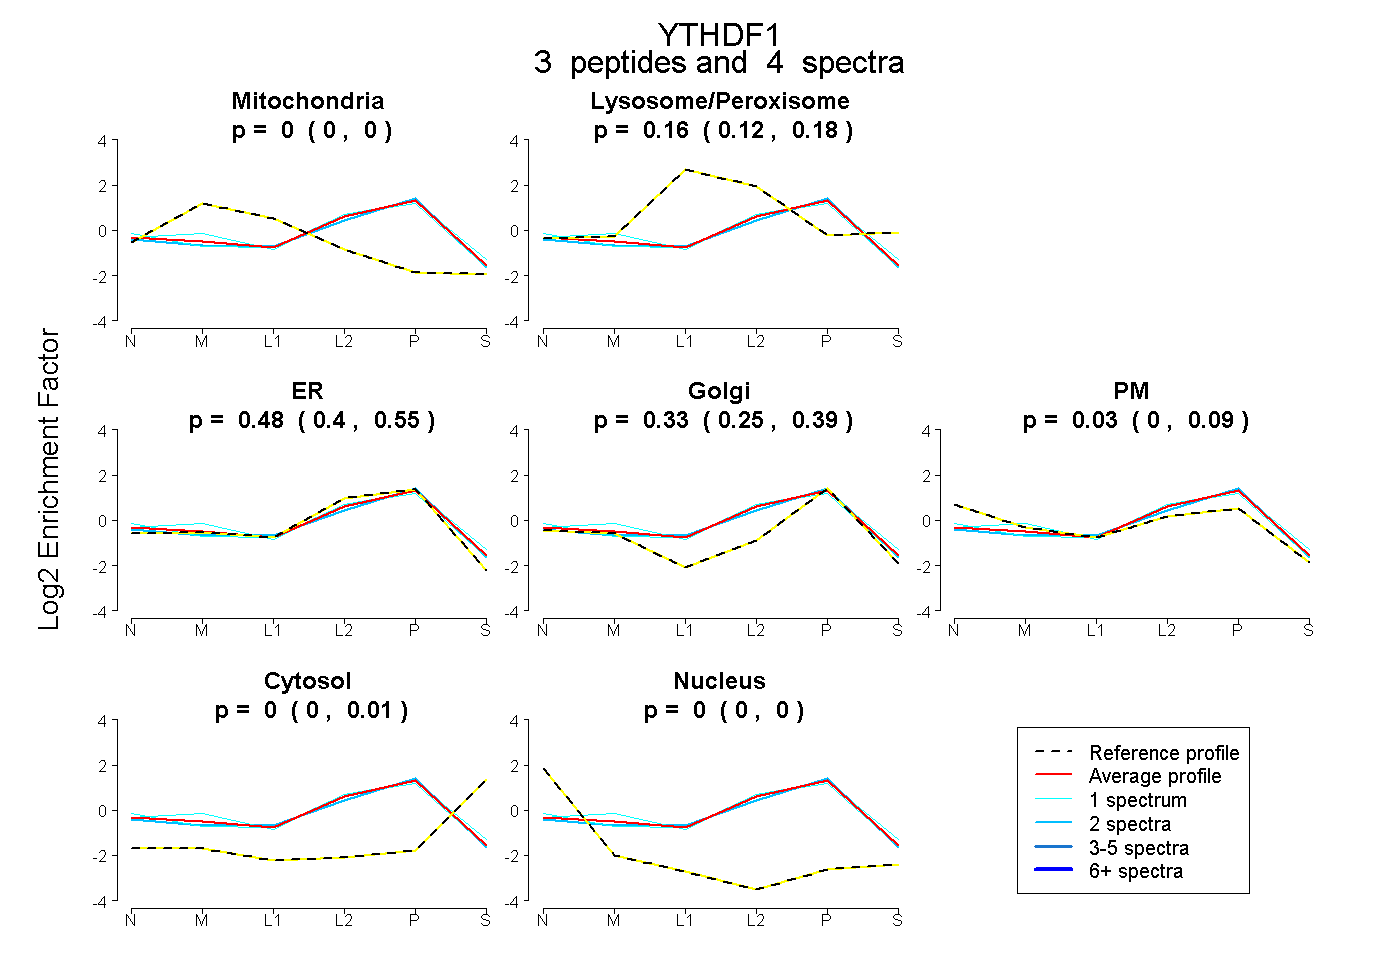
0.000 | 0.000
0.116 | 0.185
0.398 | 0.548
0.250 | 0.390
0.000 | 0.090
0.000 | 0.005
0.000 | 0.000
1peptide
spectrum
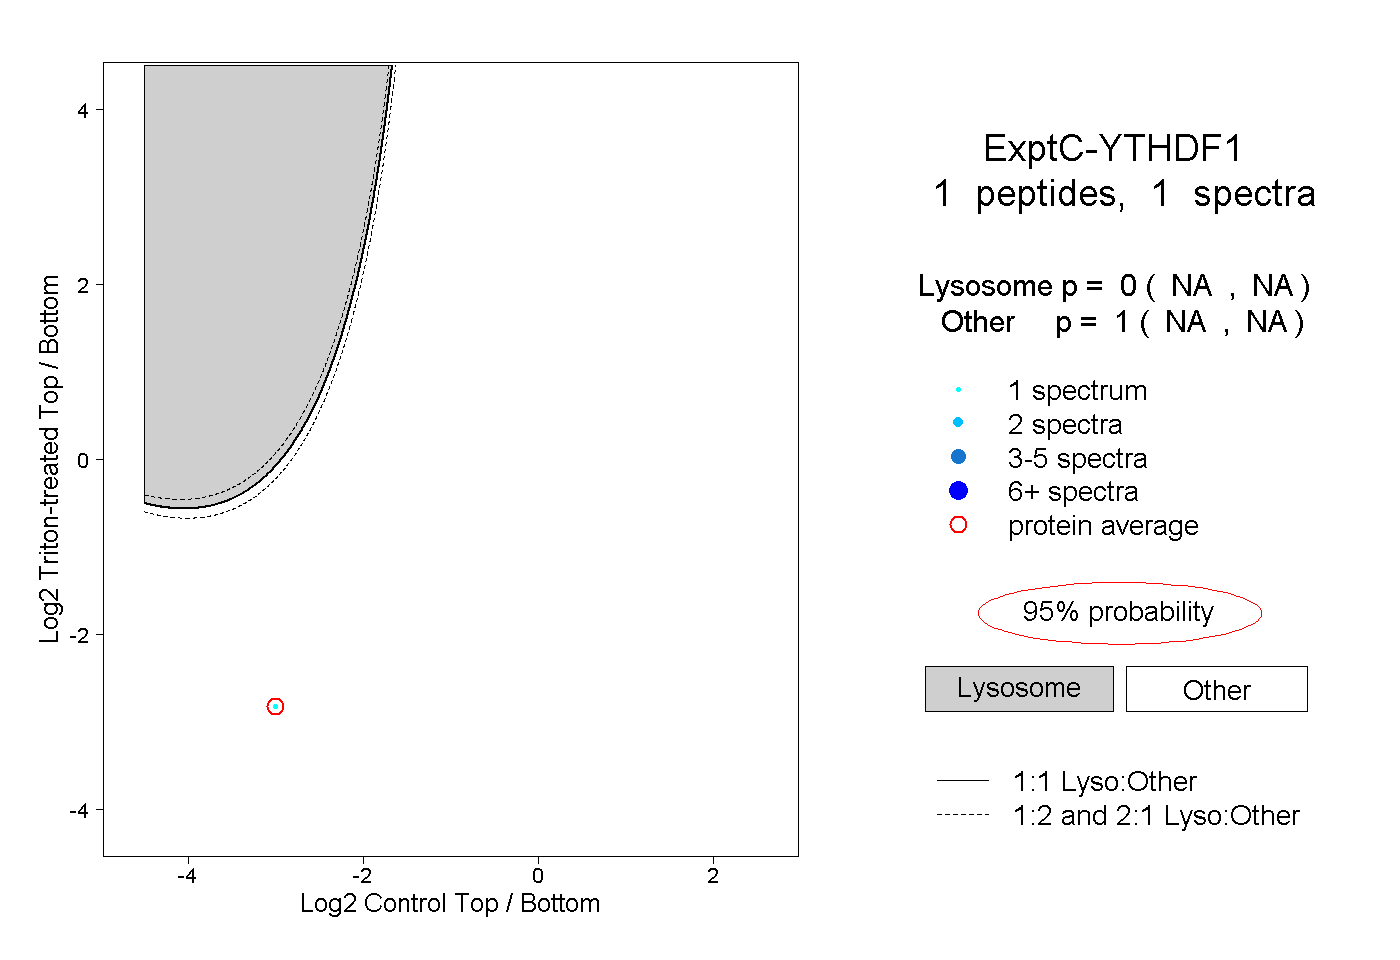
NA | NA
NA | NA