YTHDF1
[ENSRNOP00000037700]
Main page
| | | Plot |
Mito |
Lyso |
|
Perox |
ER |
Golgi |
PM |
Cytosol |
Nucleus |
|
| Expt A |
 3
3
peptides |
4
spectra |
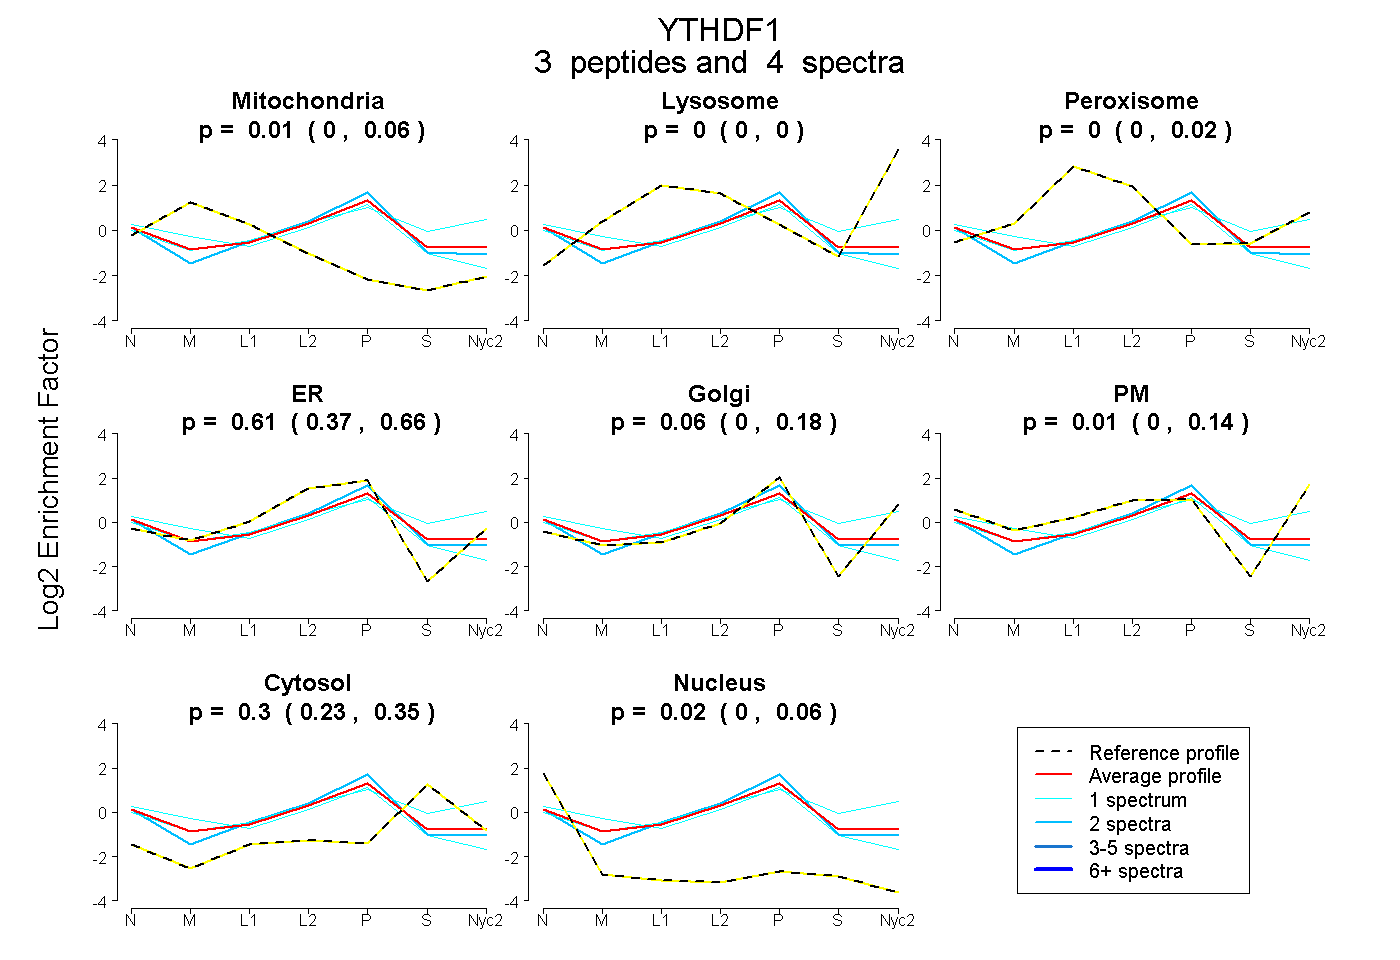 |
0.006
0.000 | 0.058 |
0.000
0.000 | 0.000 |
|
0.000
0.000 | 0.019 |
0.606
0.367 | 0.659 |
0.058
0.000 | 0.183 |
0.005
0.000 | 0.144 |
0.305
0.231 | 0.350 |
0.020
0.000 | 0.061 |
|
| | | Plot |
Mito |
|
Lyso or Perox |
|
ER |
Golgi |
PM |
Cytosol |
Nucleus |
|
| Expt B |
3
peptides |
4
spectra |
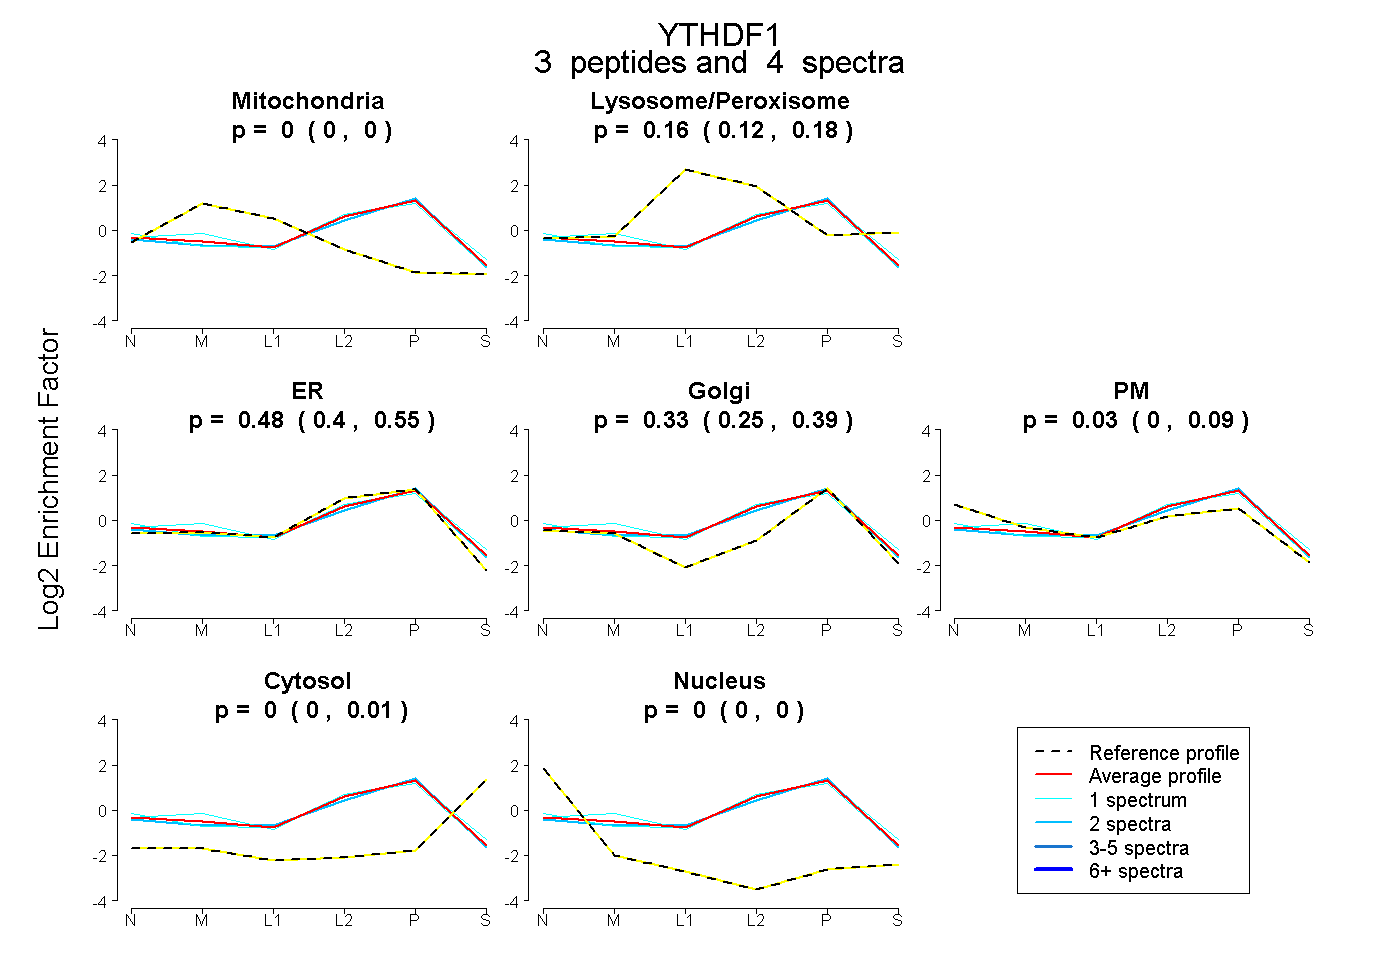 |
0.000
0.000 | 0.000 |
|
0.156
0.116 | 0.185 |
|
0.478
0.398 | 0.548 |
0.333
0.250 | 0.390 |
0.034
0.000 | 0.090 |
0.000
0.000 | 0.005 |
0.000
0.000 | 0.000 |
|
| 1 spectrum, EFDWNLK |
0.000 |
|
0.156 |
|
0.458 |
0.256 |
0.106 |
0.024 |
0.000 |
|
| 1 spectrum, SYSEDDIHR |
0.000 |
|
0.112 |
|
0.531 |
0.229 |
0.128 |
0.000 |
0.000 |
|
| 2 spectra, DVPNNQLR |
0.000 |
|
0.153 |
|
0.469 |
0.378 |
0.000 |
0.000 |
0.000 |
|
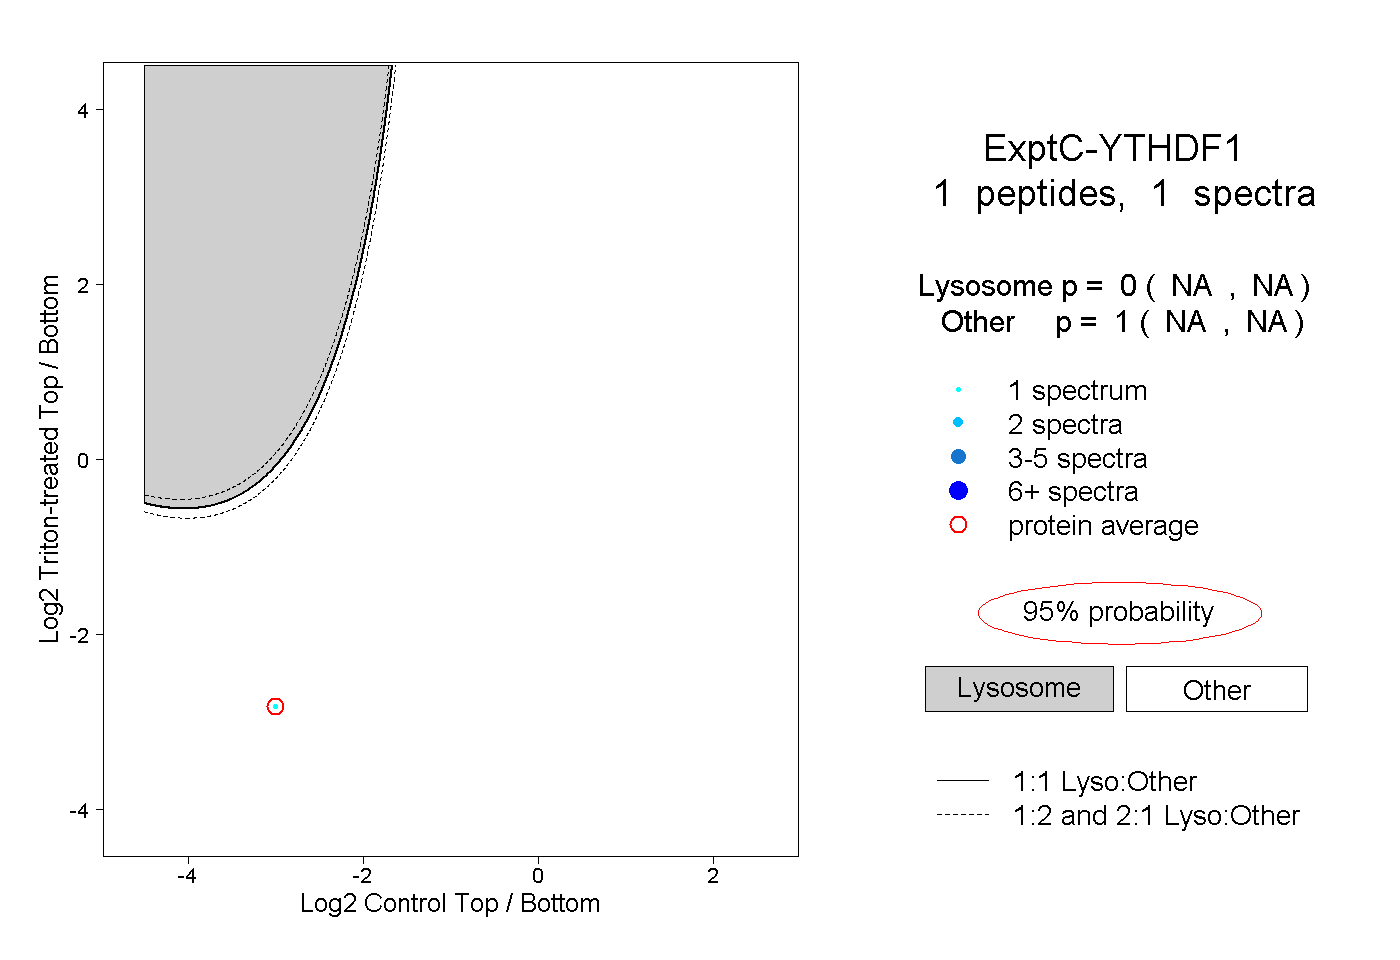
| | | Plot |
|
Lyso |
|
|
|
|
|
|
|
Other |
| Expt C |
1
peptide |
1
spectrum |
 |
|
0.000
NA | NA |
|
|
|
|
|
|
|
1.000
NA | NA |