 5
5peptides
spectra
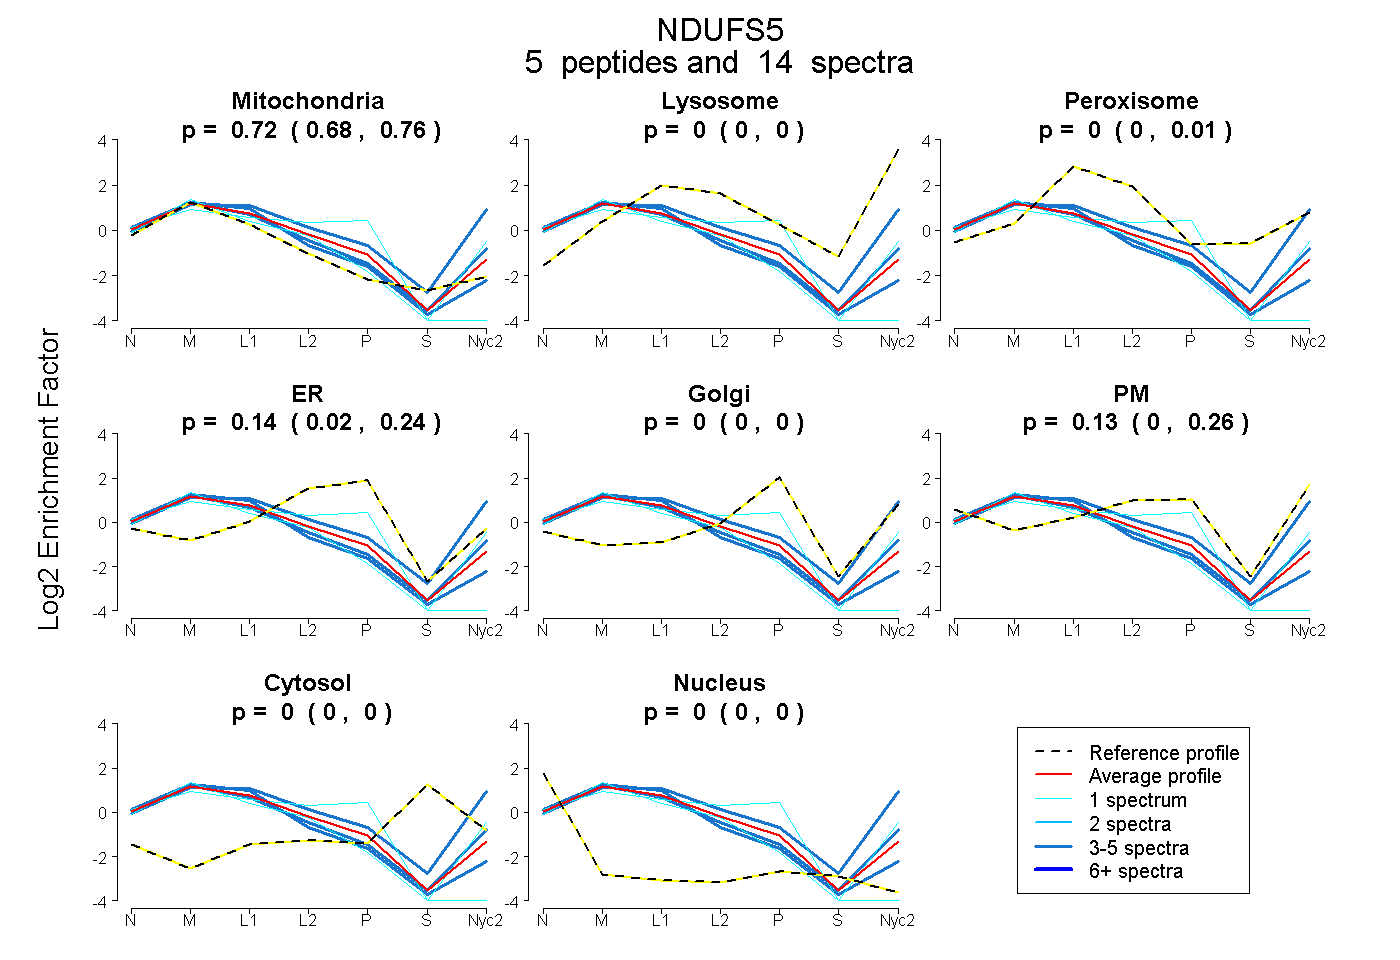
0.679 | 0.763
0.000 | 0.001
0.000 | 0.005
0.017 | 0.243
0.000 | 0.000
0.000 | 0.259
0.000 | 0.000
0.000 | 0.000
3peptides
spectra
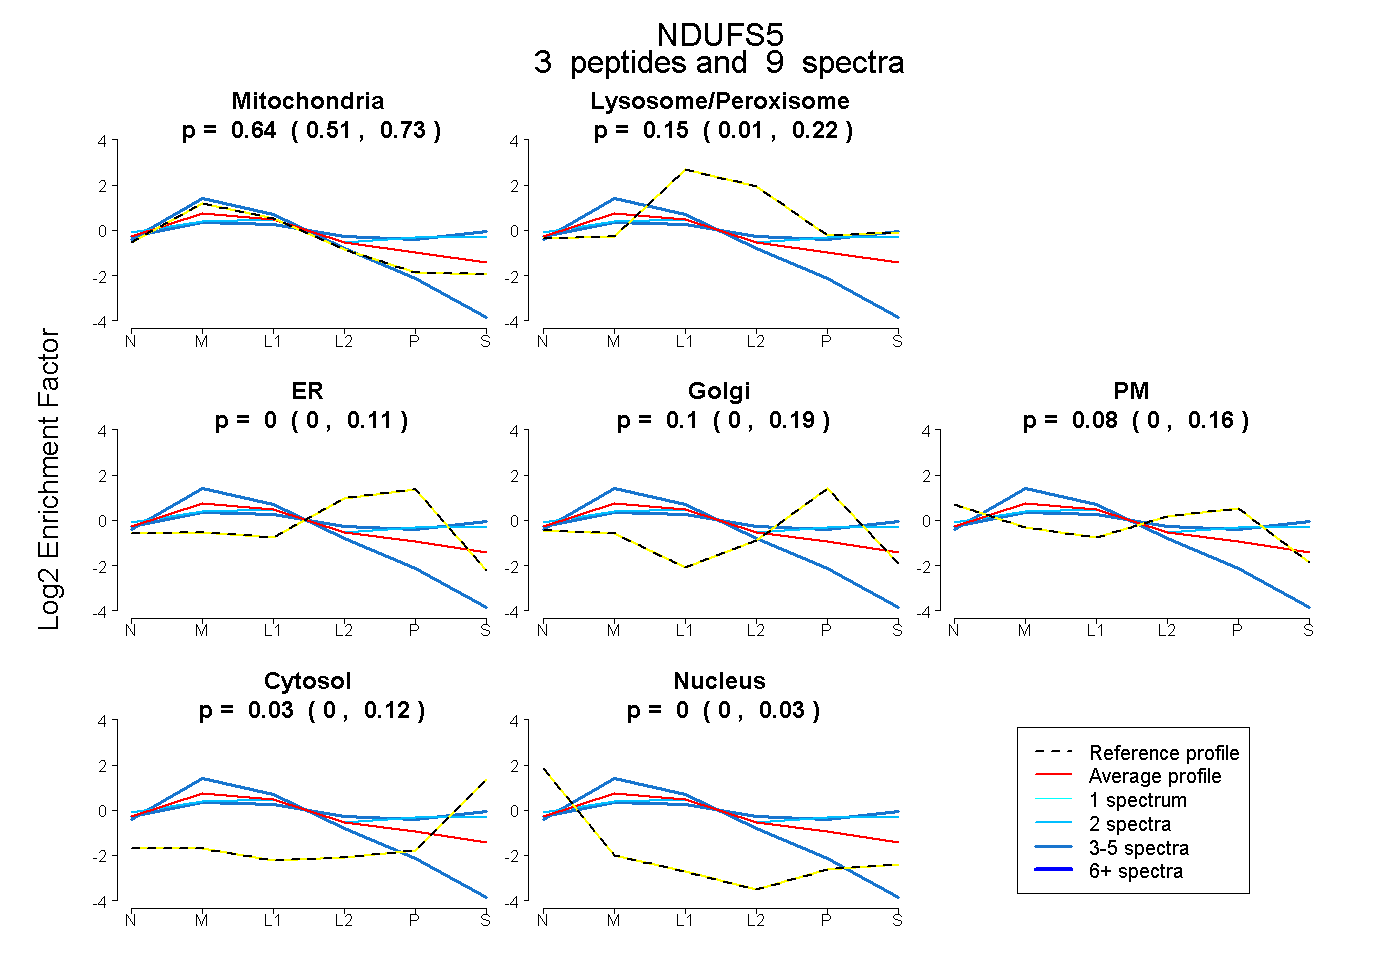
0.505 | 0.729
0.011 | 0.223
0.000 | 0.112
0.000 | 0.193
0.000 | 0.162
0.000 | 0.125
0.000 | 0.031
8peptides
spectra
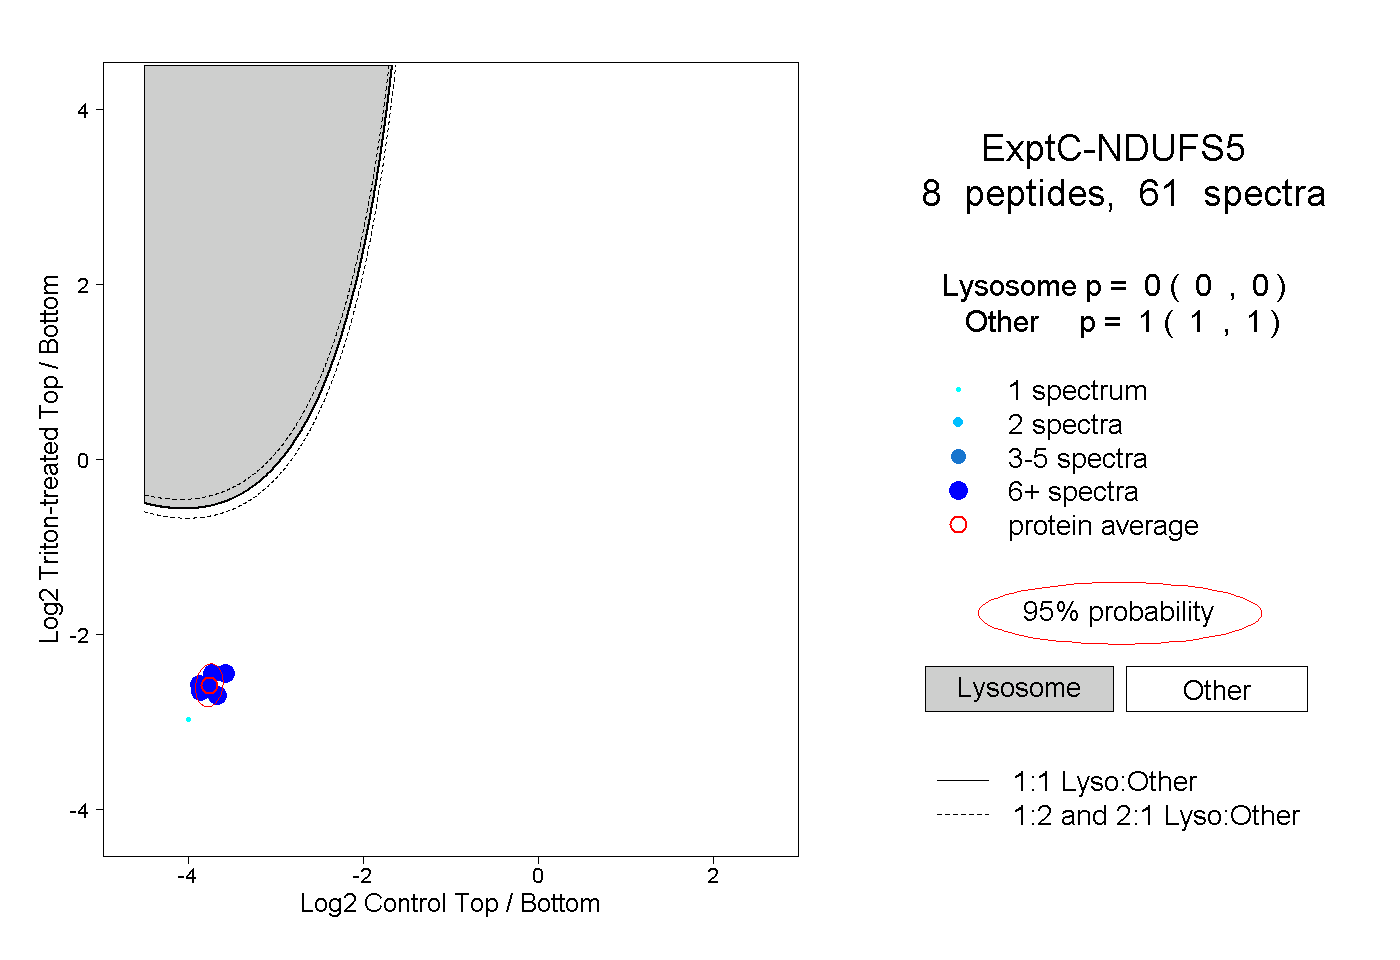
0.000 | 0.000
1.000 | 1.000
2peptides
spectra
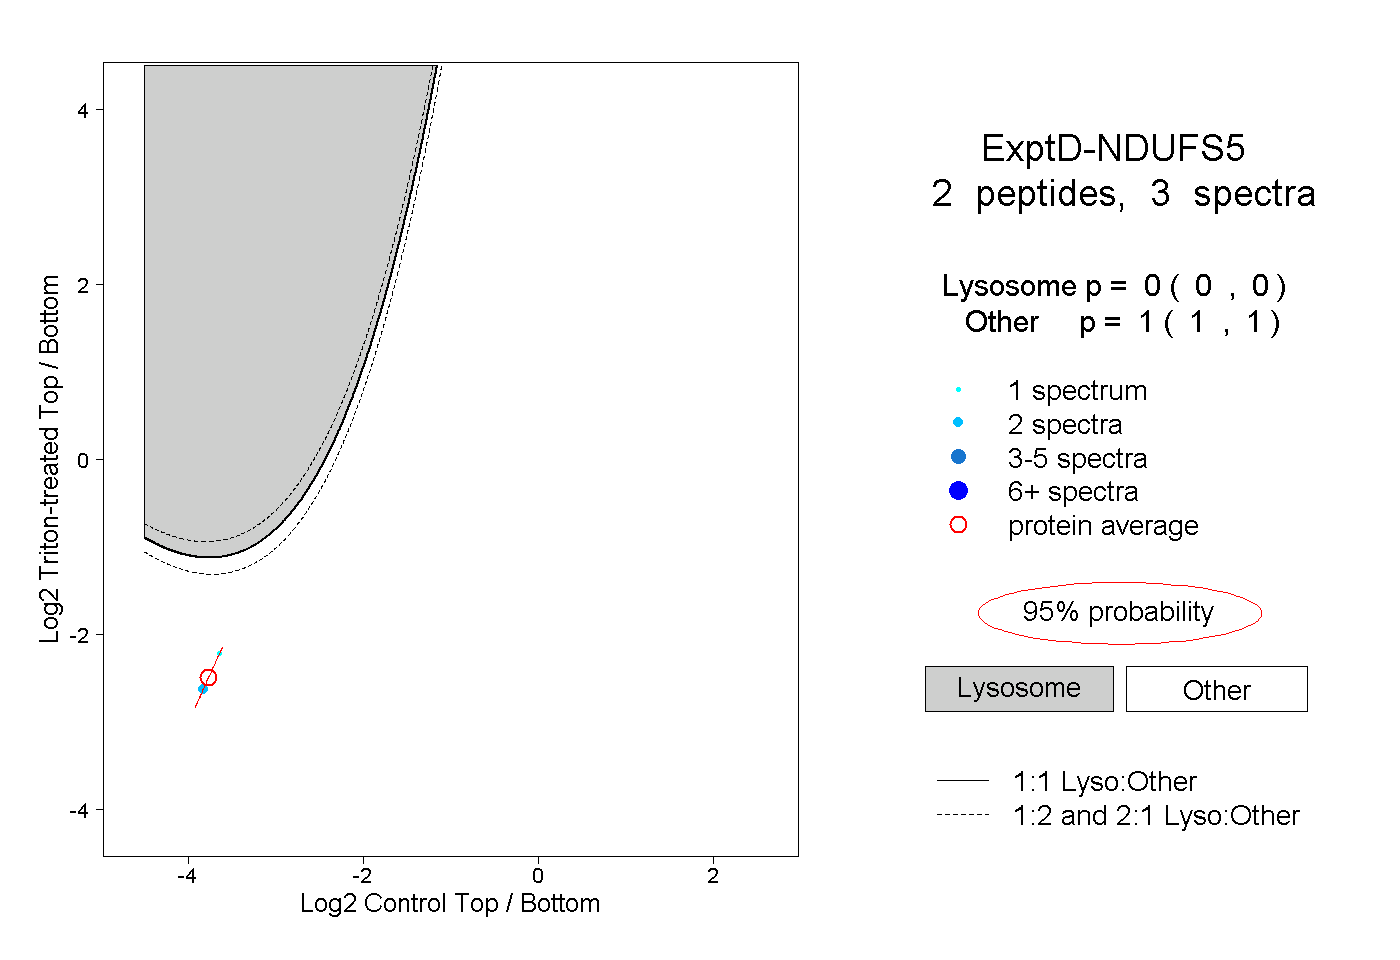
0.000 | 0.000
1.000 | 1.000