NDUFS5
[ENSRNOP00000037699]
Main page
| | | Plot |
Mito |
Lyso |
|
Perox |
ER |
Golgi |
PM |
Cytosol |
Nucleus |
|
| Expt A |
 5
5
peptides |
14
spectra |
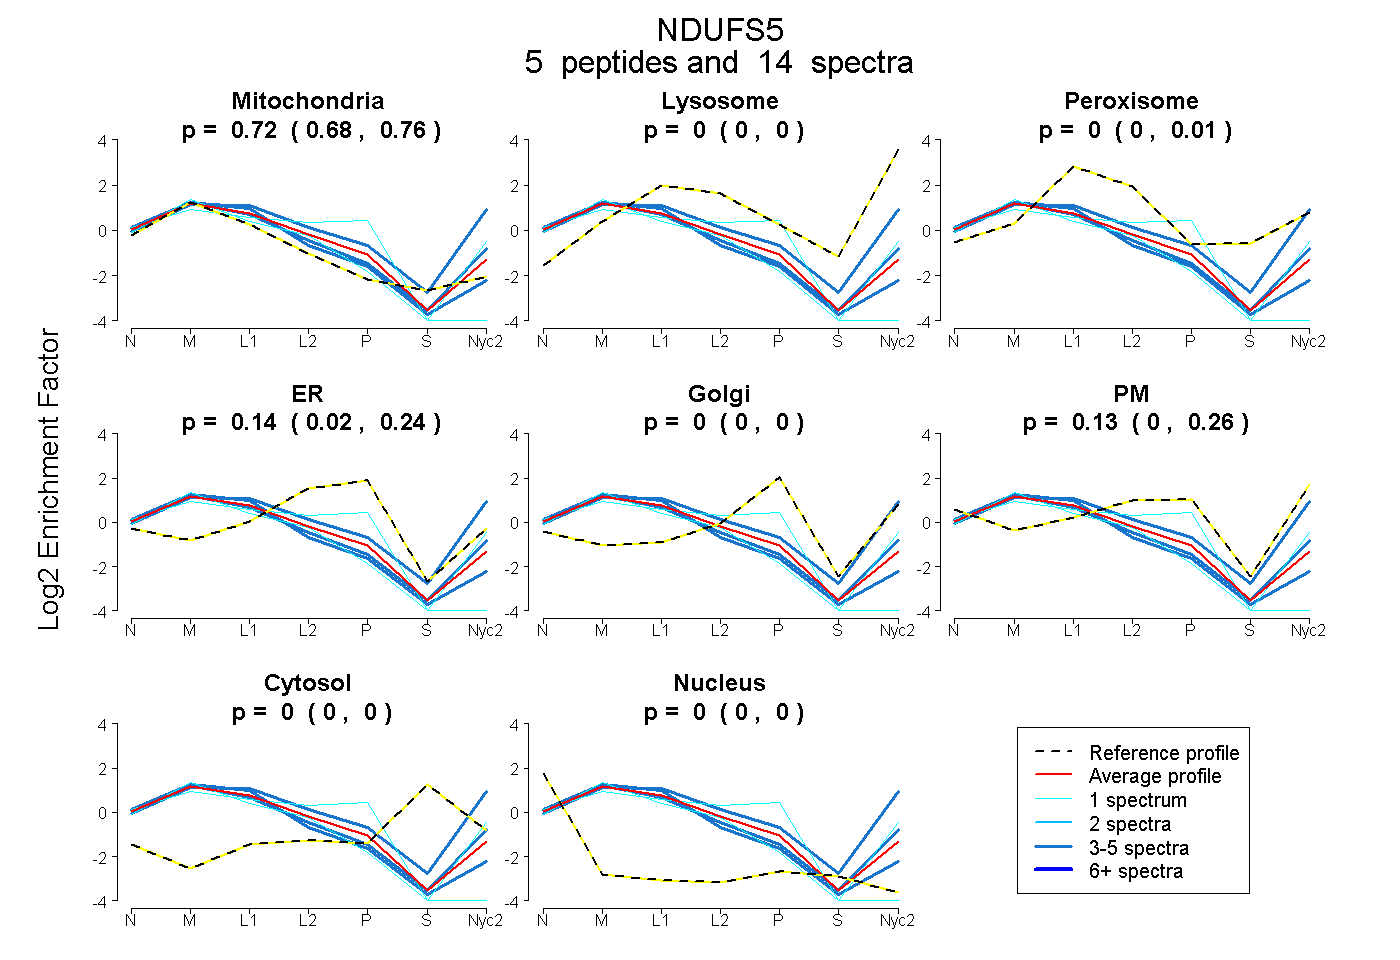 |
0.725
0.679 | 0.763 |
0.000
0.000 | 0.001 |
|
0.000
0.000 | 0.005 |
0.141
0.017 | 0.243 |
0.000
0.000 | 0.000 |
0.134
0.000 | 0.259 |
0.000
0.000 | 0.000 |
0.000
0.000 | 0.000 |
|
| | | Plot |
Mito |
|
Lyso or Perox |
|
ER |
Golgi |
PM |
Cytosol |
Nucleus |
|
| Expt B |
3
peptides |
9
spectra |
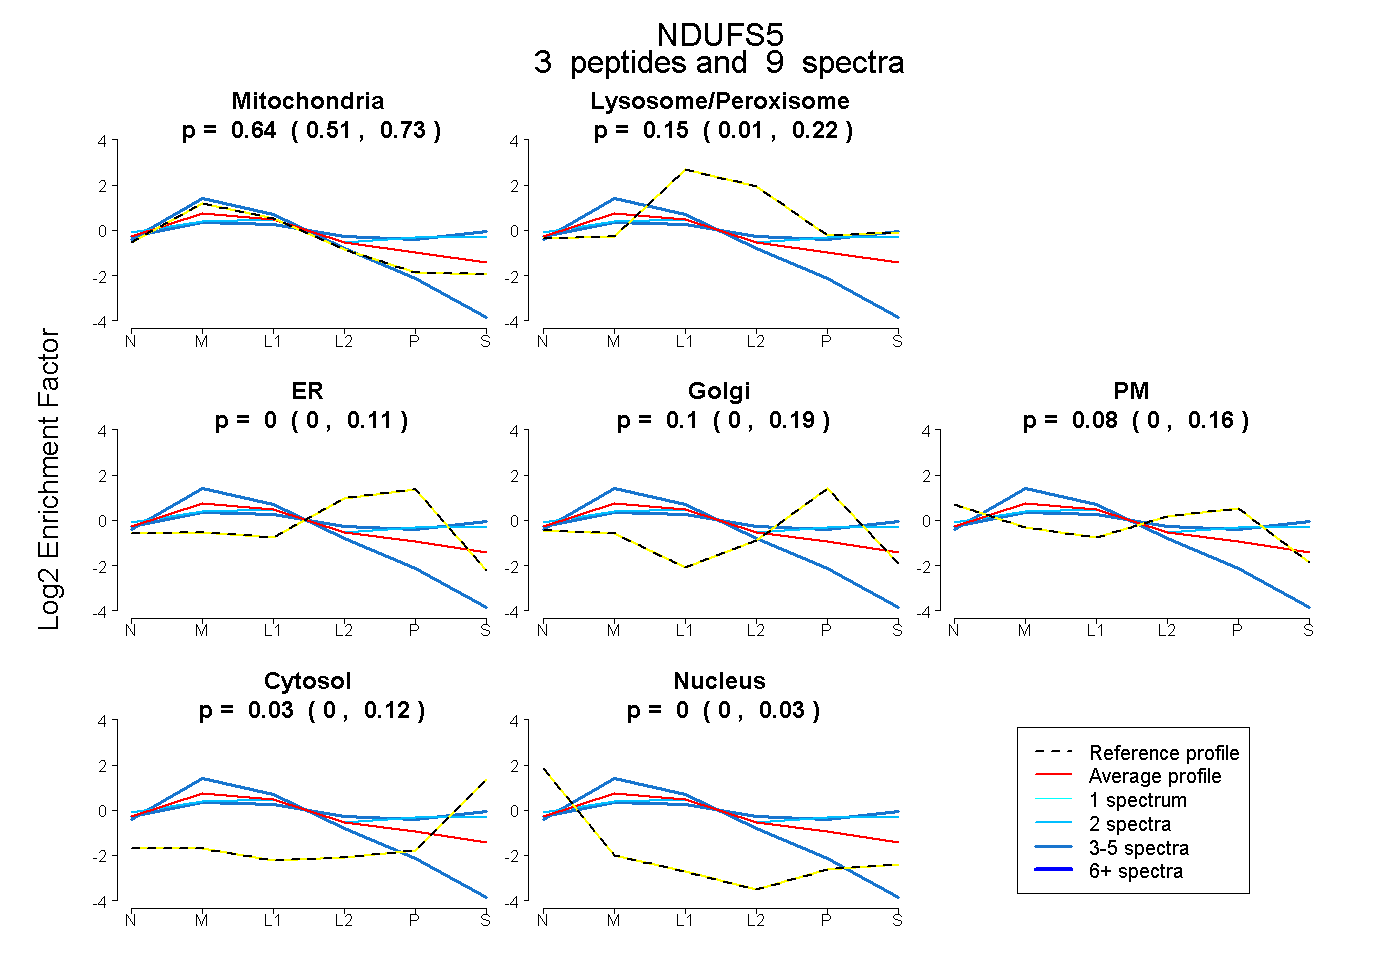 |
0.638
0.505 | 0.729 |
|
0.149
0.011 | 0.223 |
|
0.000
0.000 | 0.112 |
0.101
0.000 | 0.193 |
0.085
0.000 | 0.162 |
0.027
0.000 | 0.125 |
0.000
0.000 | 0.031 |
|
| 4 spectra, LGISLDR |
0.997 |
|
0.000 |
|
0.000 |
0.000 |
0.000 |
0.000 |
0.003 |
|
| 3 spectra, HFIFLSAEQPYK |
0.239 |
|
0.338 |
|
0.000 |
0.088 |
0.118 |
0.219 |
0.000 |
|
| 2 spectra, YTPPPHHLGK |
0.306 |
|
0.302 |
|
0.000 |
0.103 |
0.131 |
0.158 |
0.000 |
|
| | | Plot |
|
Lyso |
|
|
|
|
|
|
|
Other |
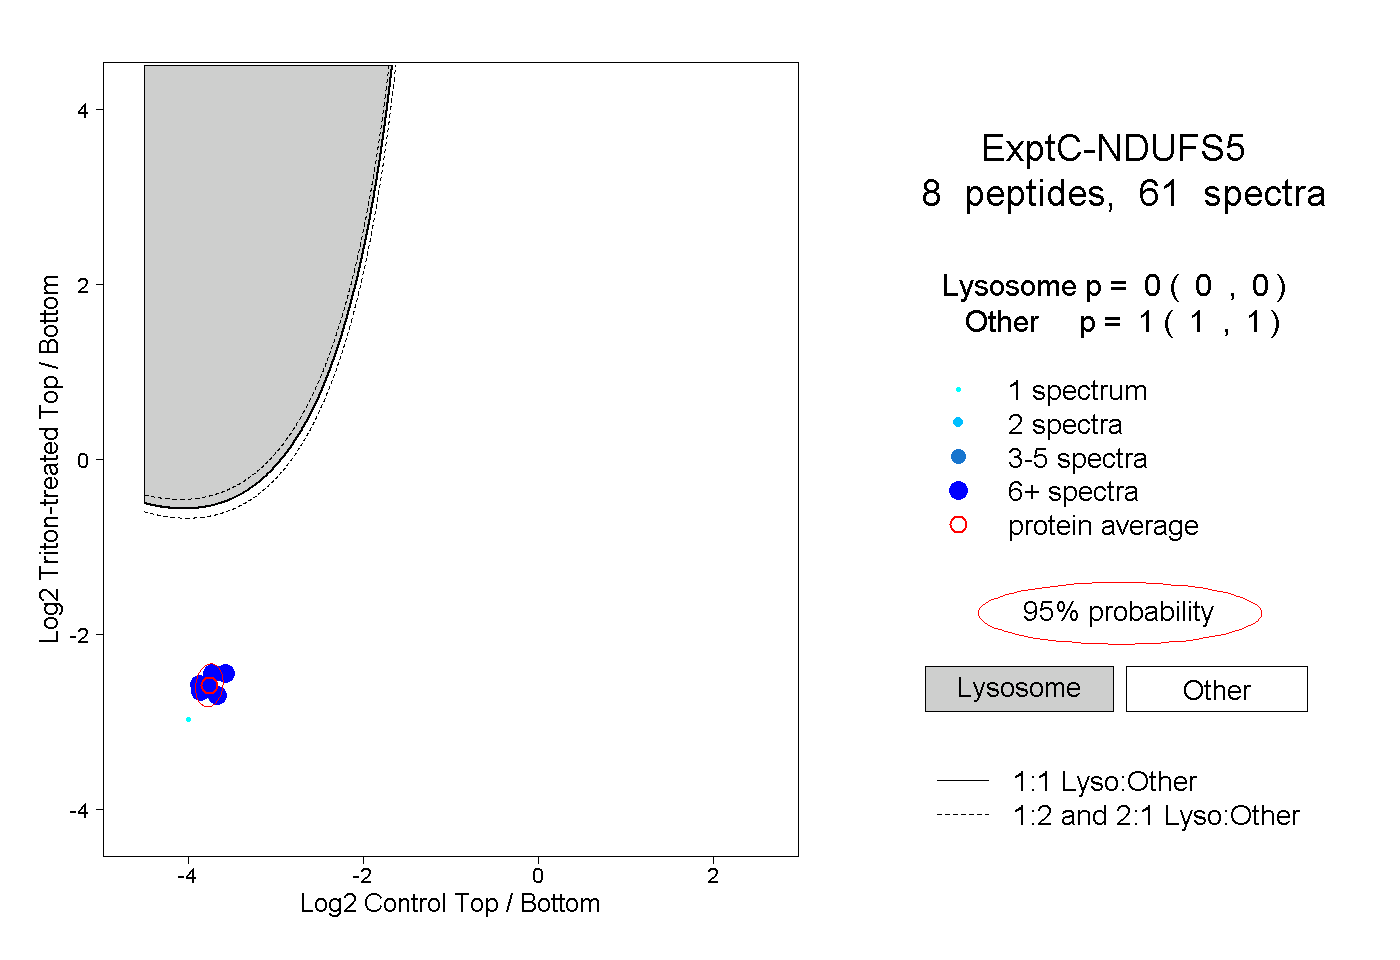
| Expt C |
8
peptides |
61
spectra |
 |
|
0.000
0.000 | 0.000 |
|
|
|
|
|
|
|
1.000
1.000 | 1.000 |
| | | Plot |
|
Lyso |
|
|
|
|
|
|
|
Other |
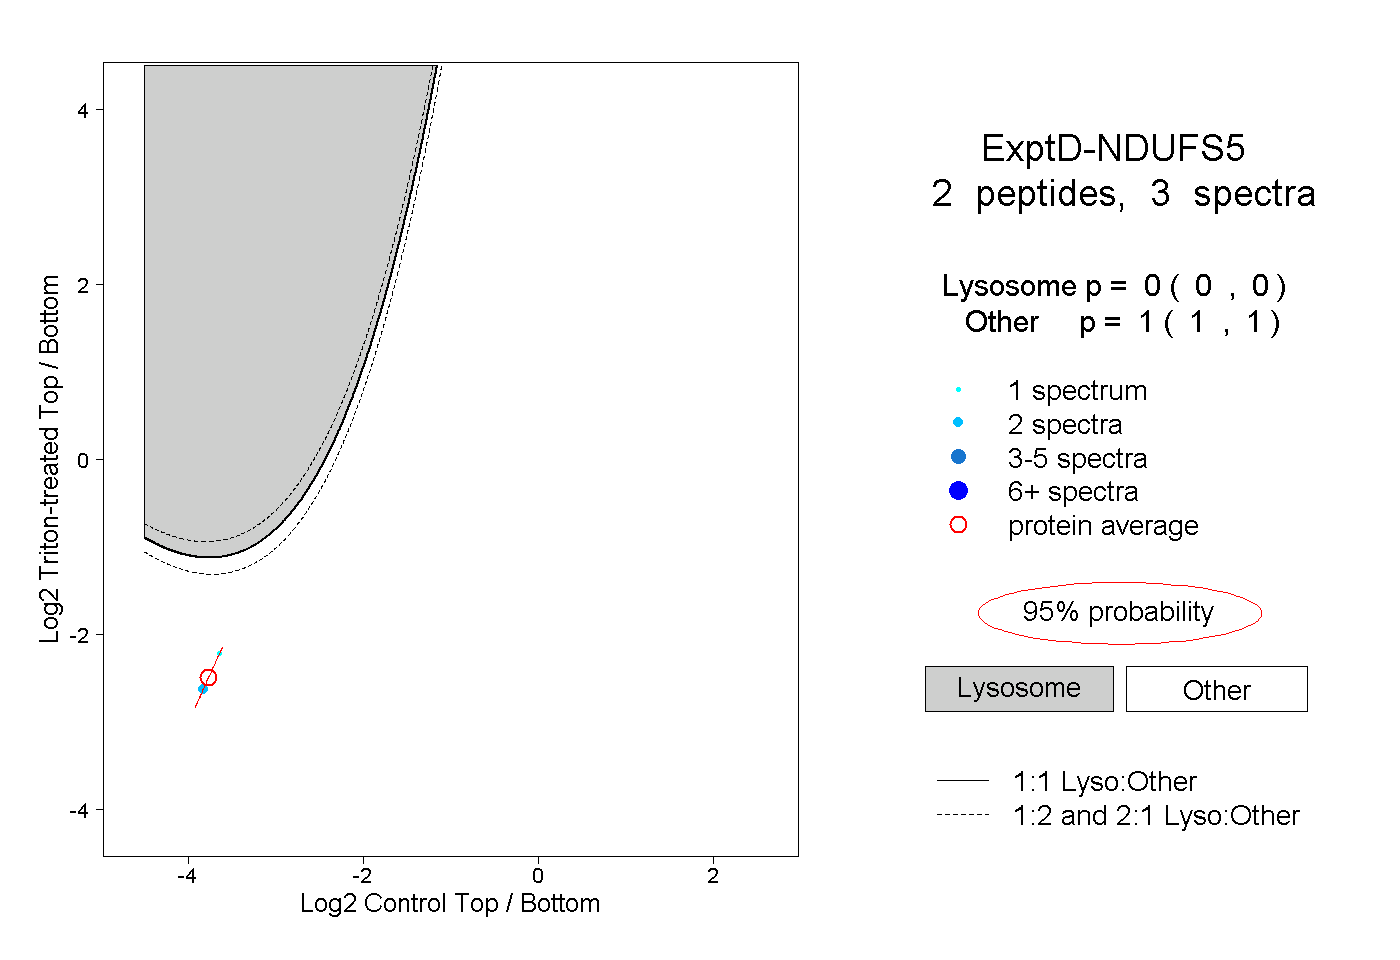
| Expt D |
2
peptides |
3
spectra |
 |
|
0.000
0.000 | 0.000 |
|
|
|
|
|
|
|
1.000
1.000 | 1.000 |