 17
17peptides
spectra
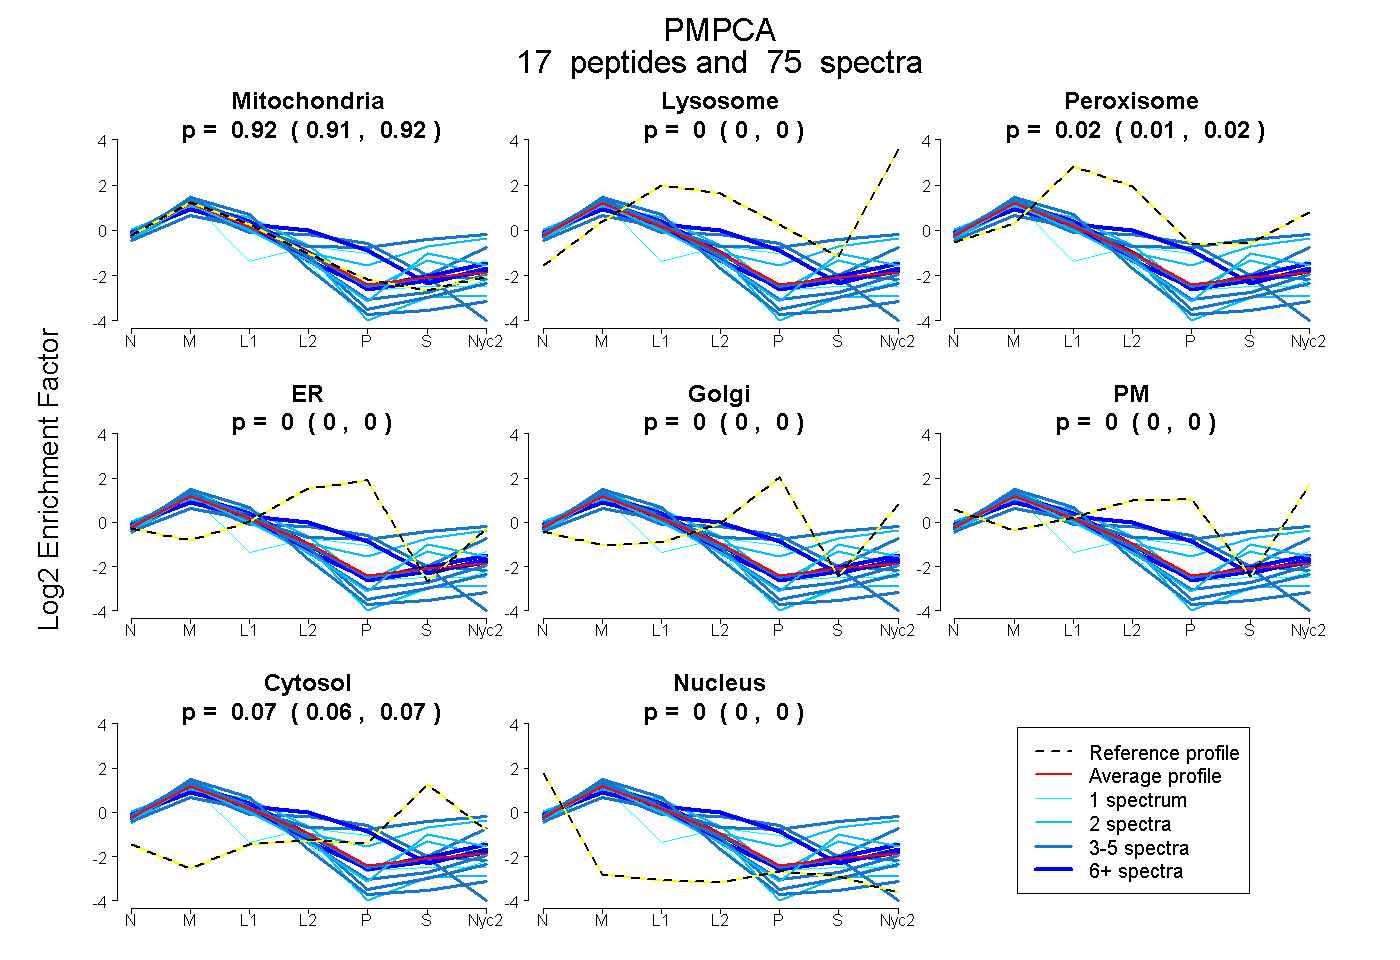
0.907 | 0.923
0.000 | 0.000
0.009 | 0.022
0.000 | 0.000
0.000 | 0.000
0.000 | 0.000
0.063 | 0.072
0.000 | 0.000
11peptides
spectra
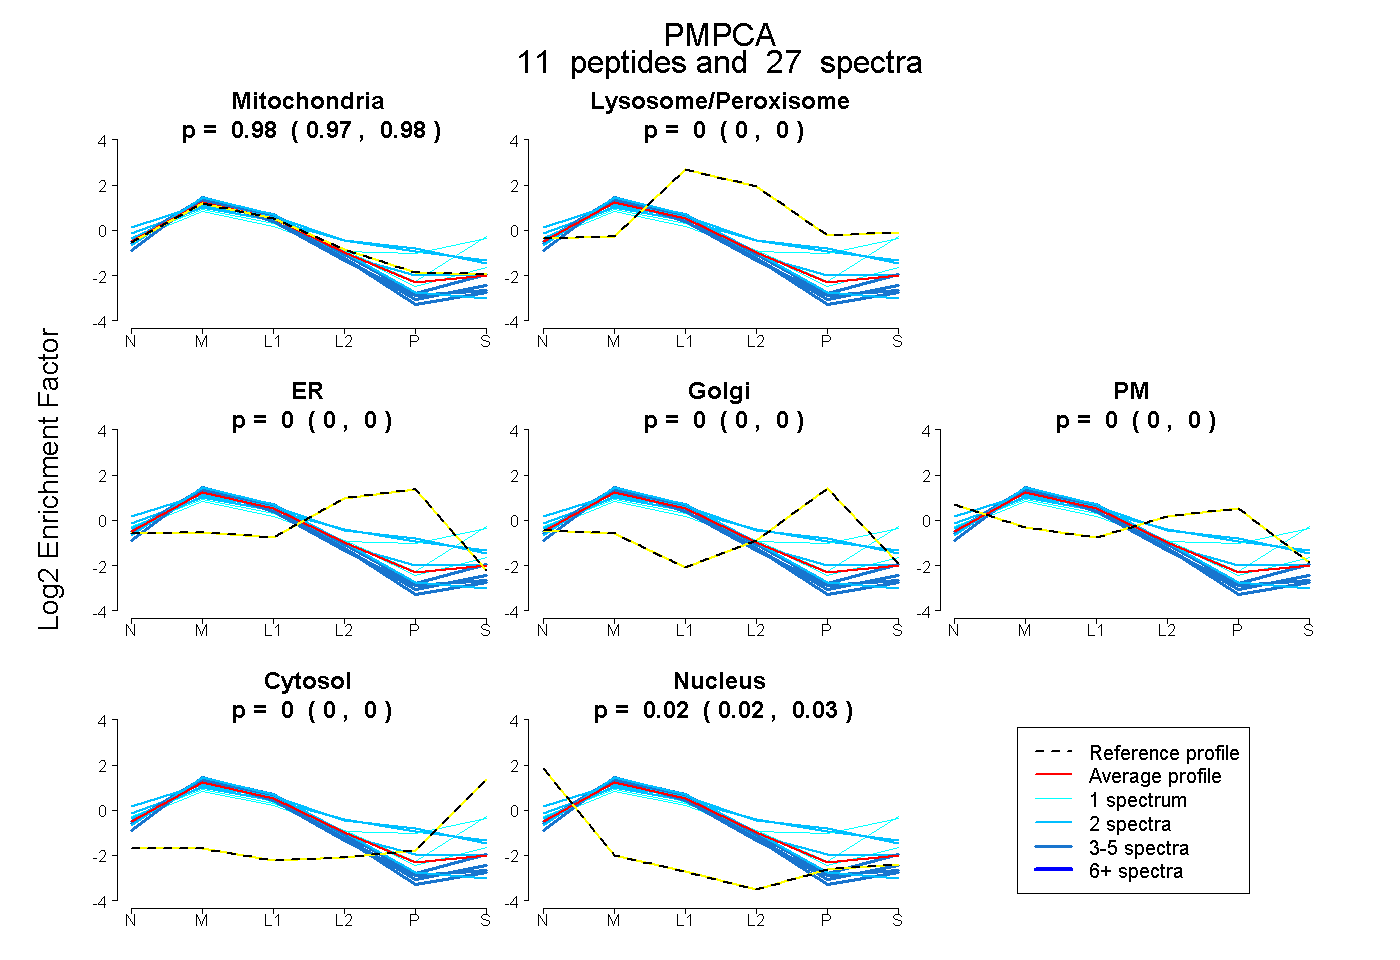
0.970 | 0.980
0.000 | 0.000
0.000 | 0.000
0.000 | 0.000
0.000 | 0.000
0.000 | 0.000
0.019 | 0.028
23peptides
spectra
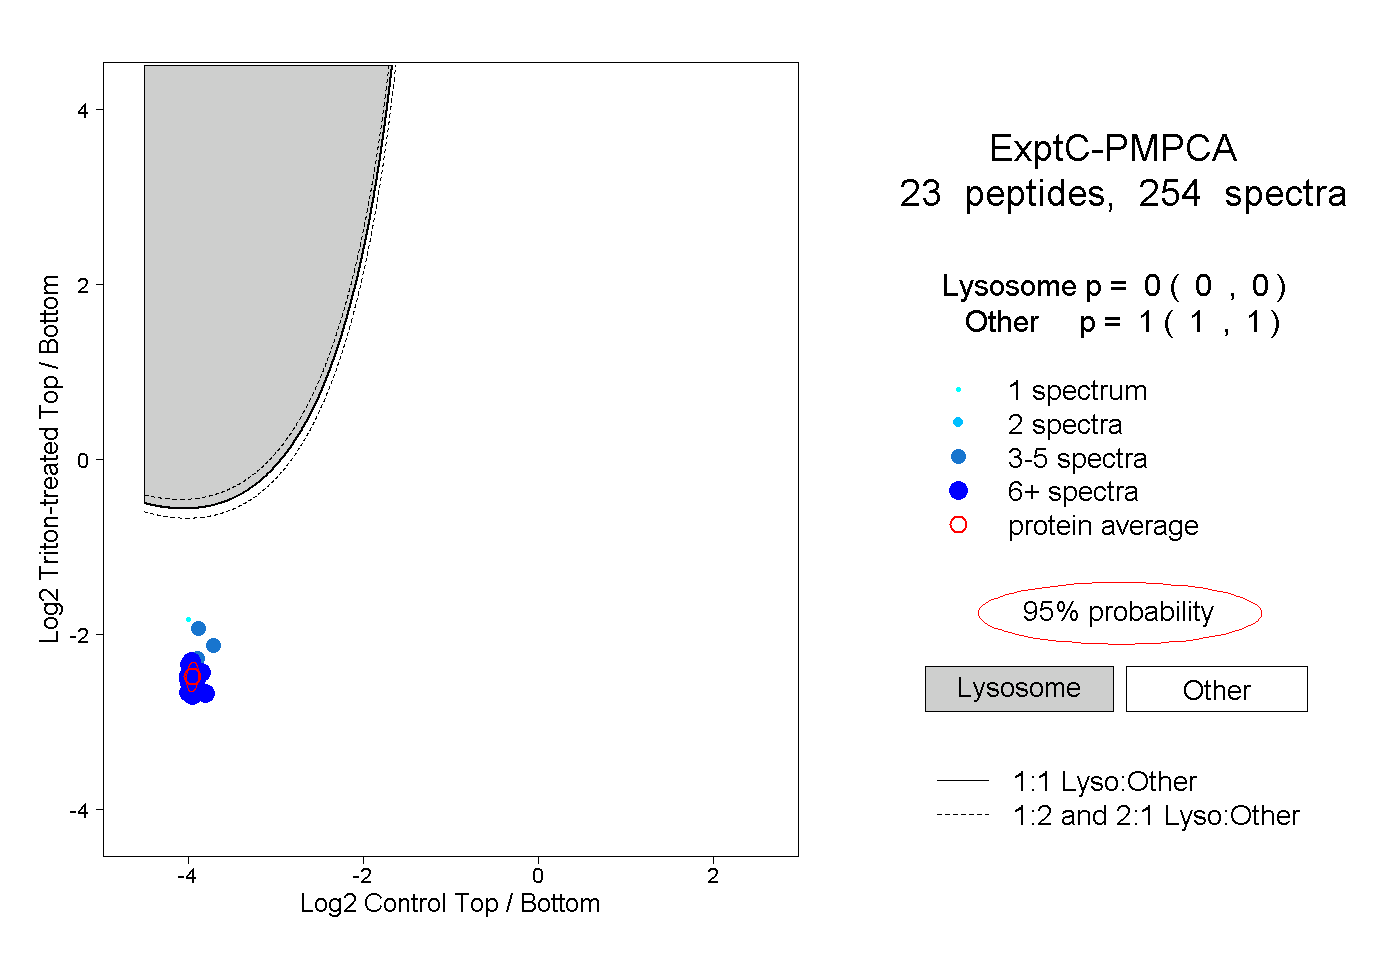
0.000 | 0.000
1.000 | 1.000
8peptides
spectra
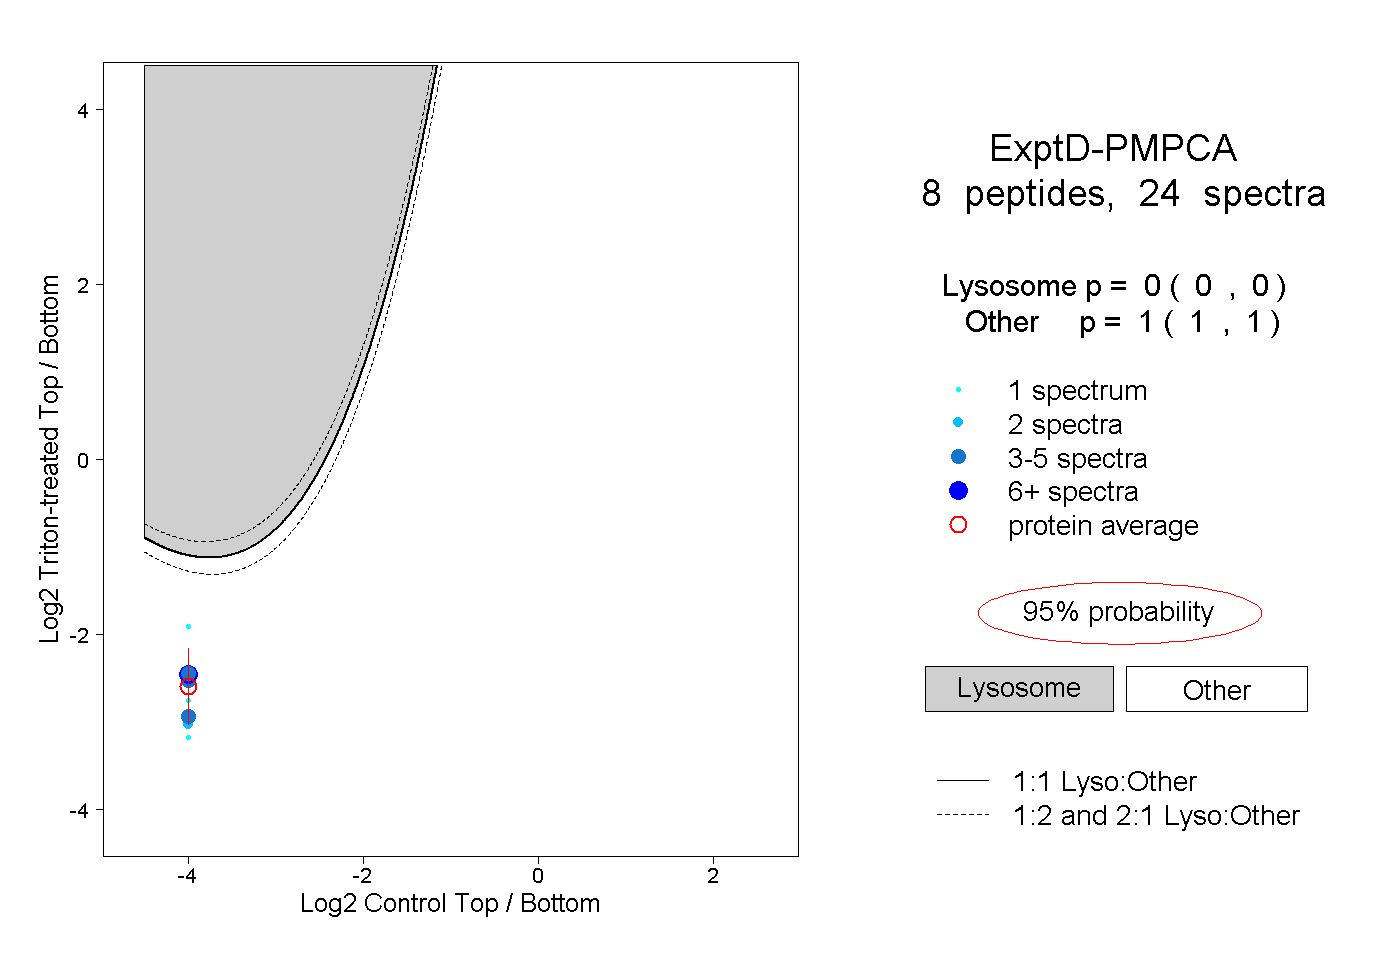
0.000 | 0.000
1.000 | 1.000