PMPCA
[ENSRNOP00000037642]
Main page
| | | Plot |
Mito |
Lyso |
|
Perox |
ER |
Golgi |
PM |
Cytosol |
Nucleus |
|
| Expt A |
 17
17
peptides |
75
spectra |
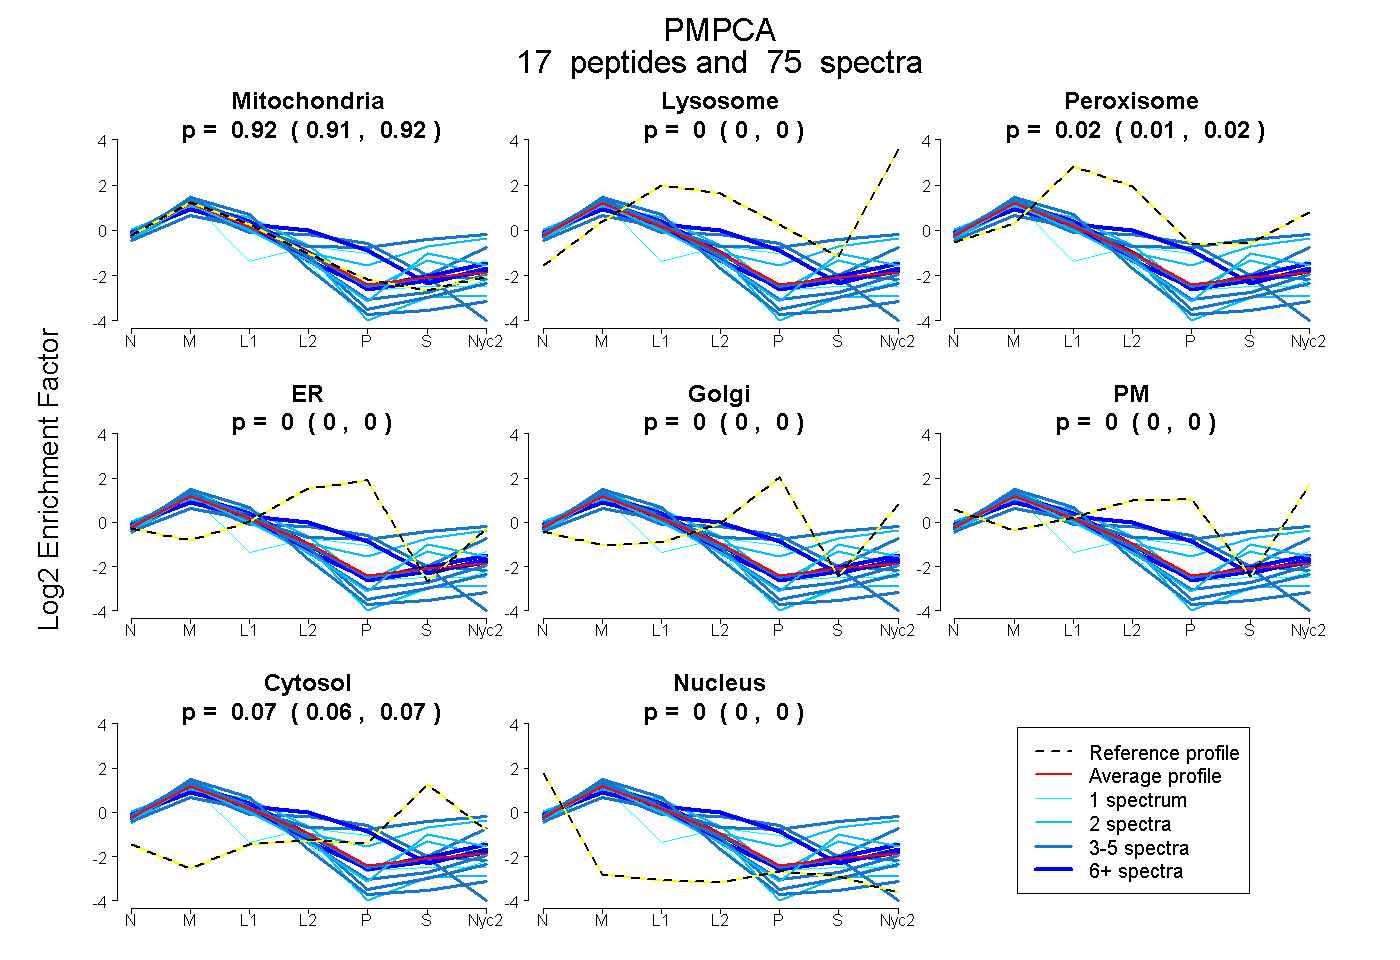 |
0.916
0.907 | 0.923 |
0.000
0.000 | 0.000 |
|
0.016
0.009 | 0.022 |
0.000
0.000 | 0.000 |
0.000
0.000 | 0.000 |
0.000
0.000 | 0.000 |
0.068
0.063 | 0.072 |
0.000
0.000 | 0.000 |
|
| | | Plot |
Mito |
|
Lyso or Perox |
|
ER |
Golgi |
PM |
Cytosol |
Nucleus |
|
| Expt B |
11
peptides |
27
spectra |
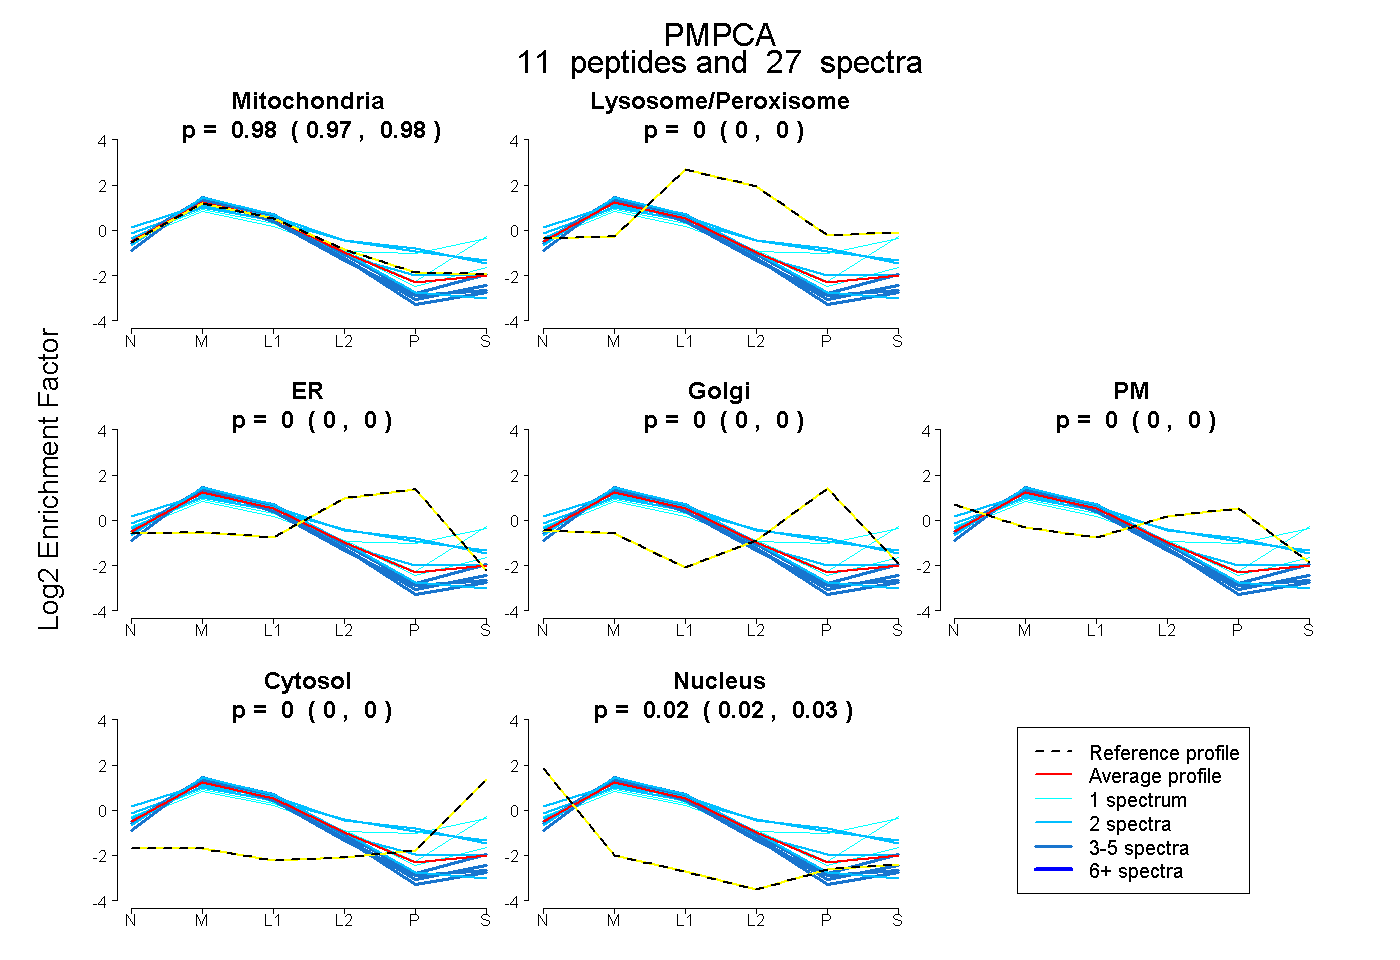 |
0.976
0.970 | 0.980 |
|
0.000
0.000 | 0.000 |
|
0.000
0.000 | 0.000 |
0.000
0.000 | 0.000 |
0.000
0.000 | 0.000 |
0.000
0.000 | 0.000 |
0.024
0.019 | 0.028 |
|
| 2 spectra, VTTLDNGLR |
1.000 |
|
0.000 |
|
0.000 |
0.000 |
0.000 |
0.000 |
0.000 |
|
| 5 spectra, TVDLVELER |
0.991 |
|
0.000 |
|
0.000 |
0.000 |
0.000 |
0.000 |
0.009 |
|
| 1 spectrum, EVLHSYLK |
0.674 |
|
0.100 |
|
0.000 |
0.000 |
0.000 |
0.226 |
0.000 |
|
| 2 spectra, NYYTPDR |
0.923 |
|
0.008 |
|
0.000 |
0.000 |
0.000 |
0.000 |
0.068 |
|
| 2 spectra, QVLATHSR |
0.673 |
|
0.180 |
|
0.000 |
0.147 |
0.000 |
0.000 |
0.000 |
|
| 4 spectra, LAFSSTAR |
0.943 |
|
0.000 |
|
0.000 |
0.000 |
0.000 |
0.000 |
0.057 |
|
| 2 spectra, ENTVGLHR |
0.644 |
|
0.133 |
|
0.000 |
0.044 |
0.166 |
0.013 |
0.000 |
|
| 1 spectrum, HGGICDCQTSR |
0.555 |
|
0.169 |
|
0.000 |
0.057 |
0.000 |
0.219 |
0.000 |
|
| 4 spectra, LTDEEIEMTR |
0.989 |
|
0.000 |
|
0.000 |
0.000 |
0.000 |
0.000 |
0.011 |
|
| 3 spectra, LYLNVLNR |
0.961 |
|
0.000 |
|
0.000 |
0.000 |
0.000 |
0.000 |
0.039 |
|
| 1 spectrum, EFILMGR |
0.954 |
|
0.000 |
|
0.000 |
0.000 |
0.000 |
0.046 |
0.000 |
|
| | | Plot |
|
Lyso |
|
|
|
|
|
|
|
Other |
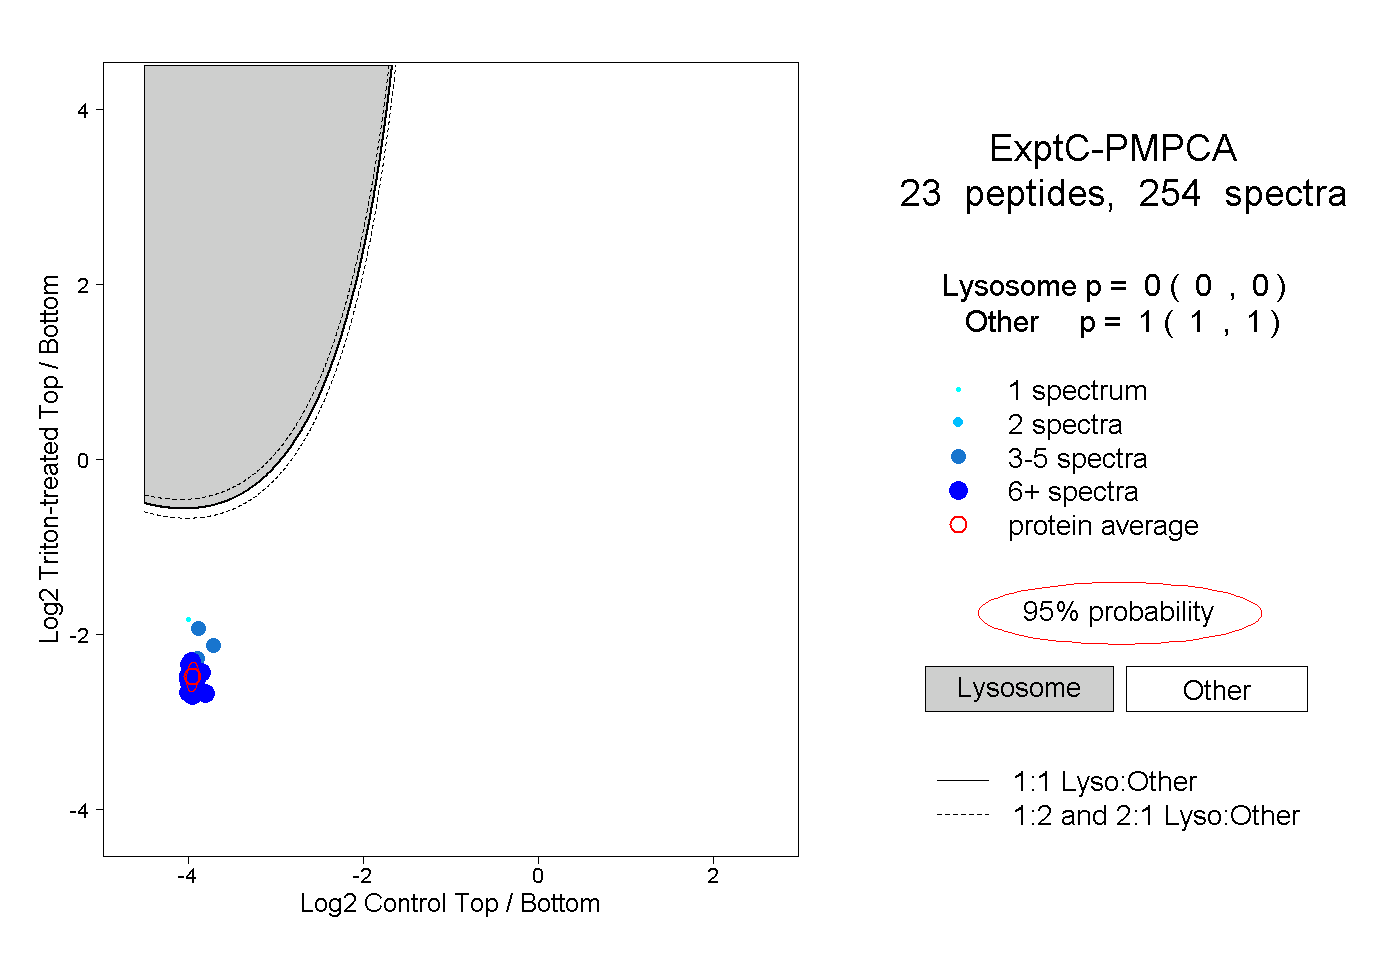
| Expt C |
23
peptides |
254
spectra |
 |
|
0.000
0.000 | 0.000 |
|
|
|
|
|
|
|
1.000
1.000 | 1.000 |
| | | Plot |
|
Lyso |
|
|
|
|
|
|
|
Other |
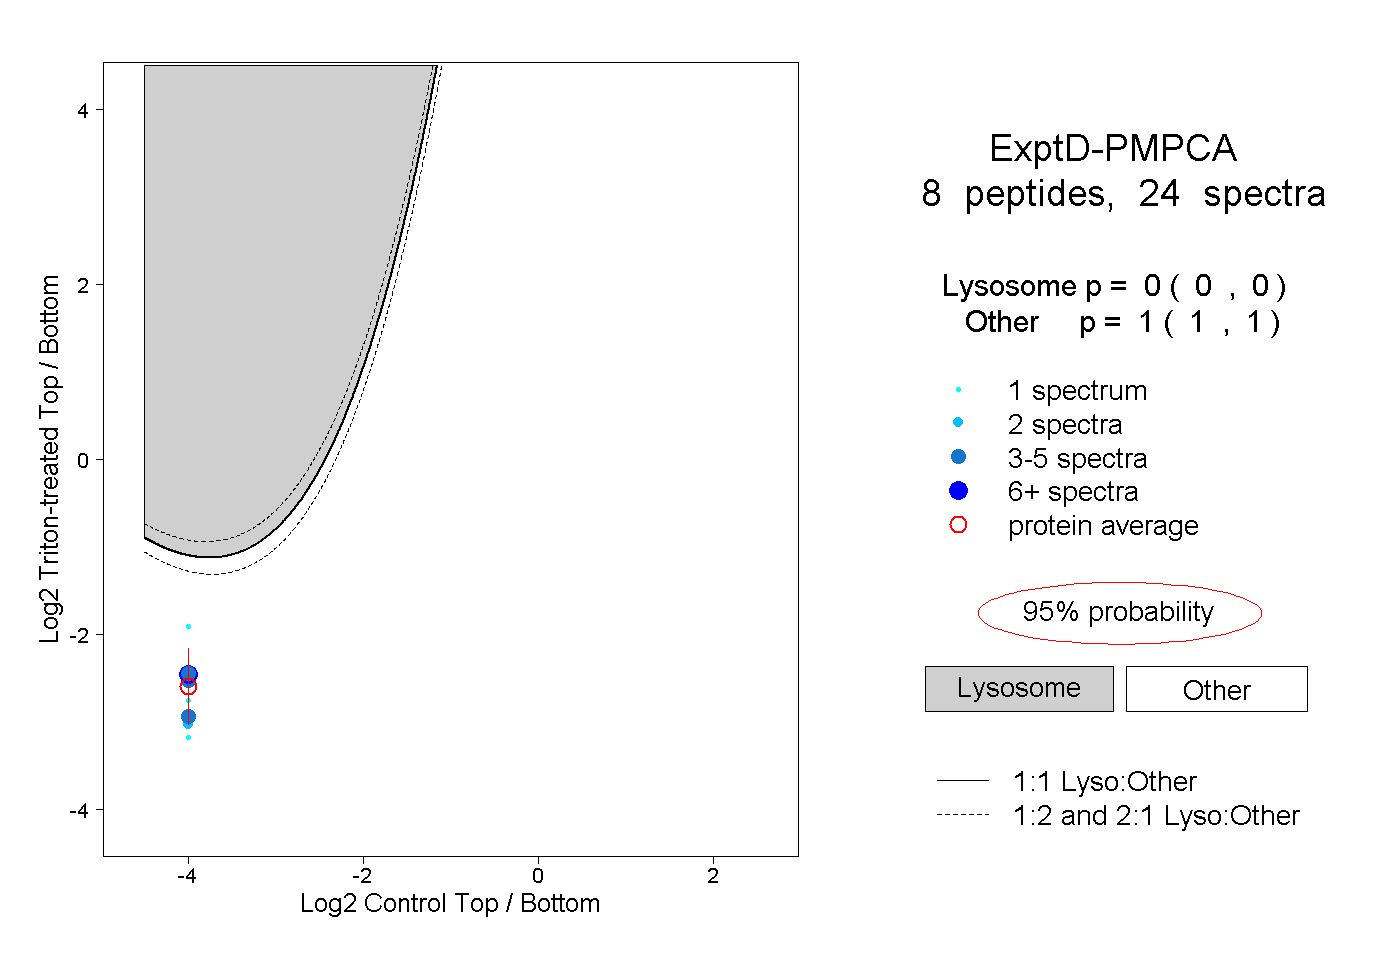
| Expt D |
8
peptides |
24
spectra |
 |
|
0.000
0.000 | 0.000 |
|
|
|
|
|
|
|
1.000
1.000 | 1.000 |