 13
13peptides
spectra
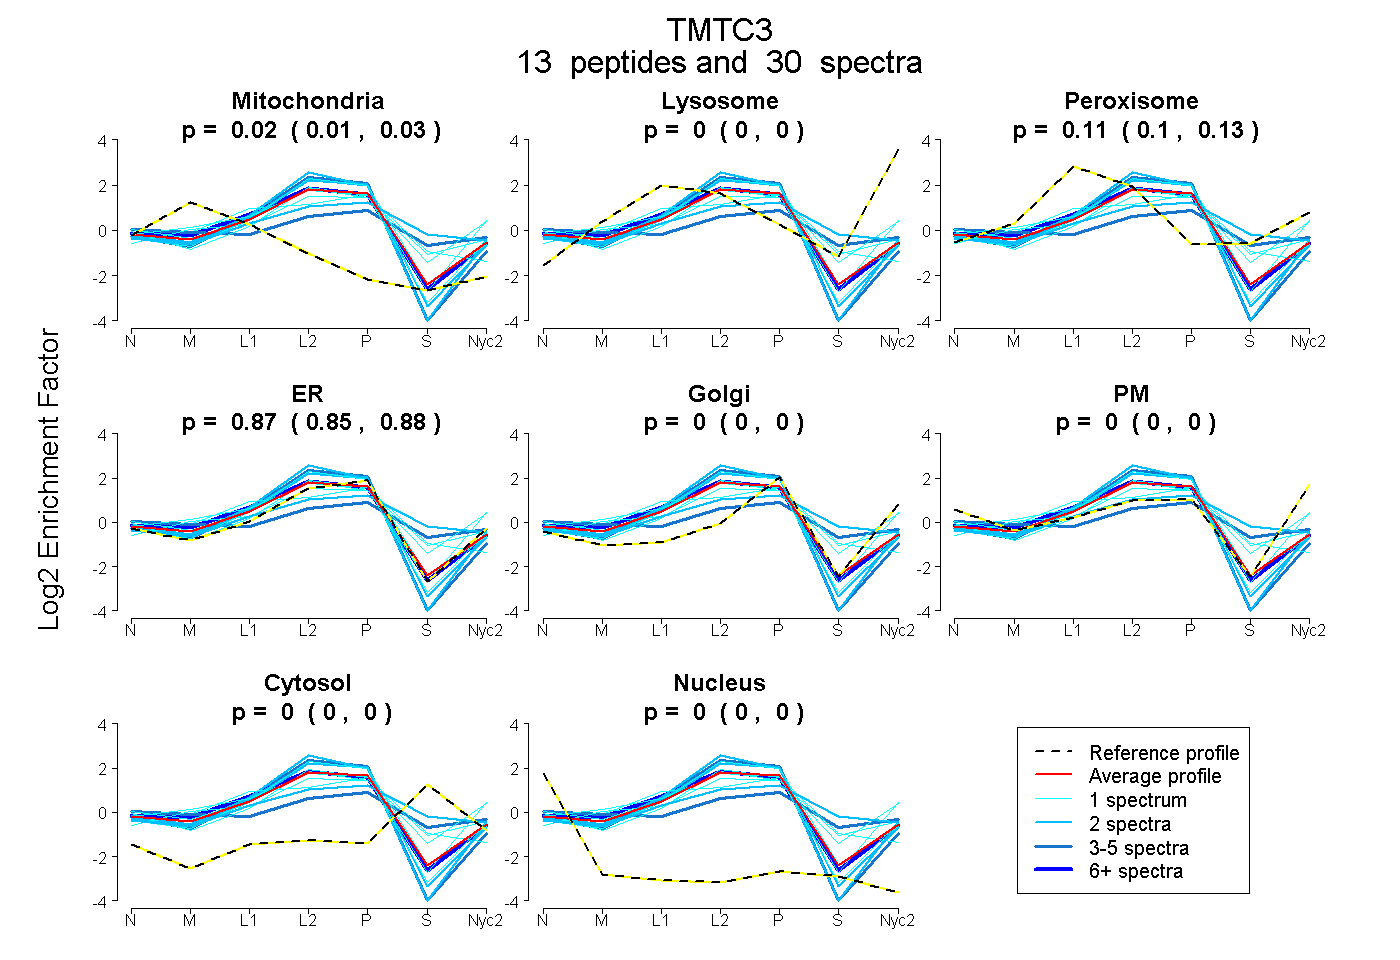
0.010 | 0.029
0.000 | 0.000
0.096 | 0.130
0.852 | 0.877
0.000 | 0.000
0.000 | 0.000
0.000 | 0.000
0.000 | 0.000
4peptides
spectra
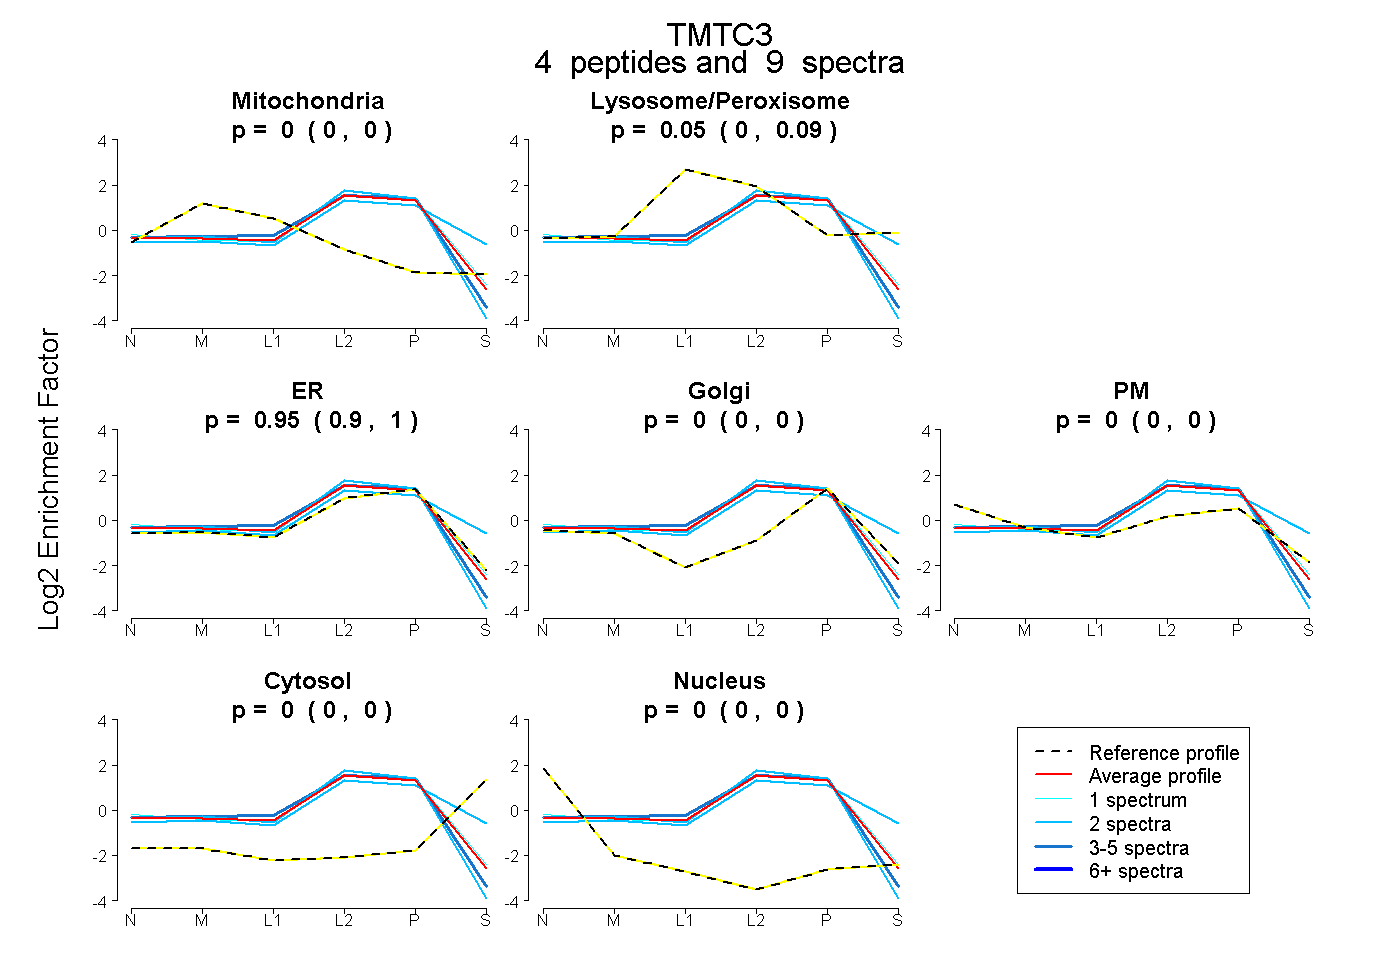
0.000 | 0.000
0.000 | 0.091
0.898 | 0.999
0.000 | 0.000
0.000 | 0.000
0.000 | 0.000
0.000 | 0.000
16peptides
spectra
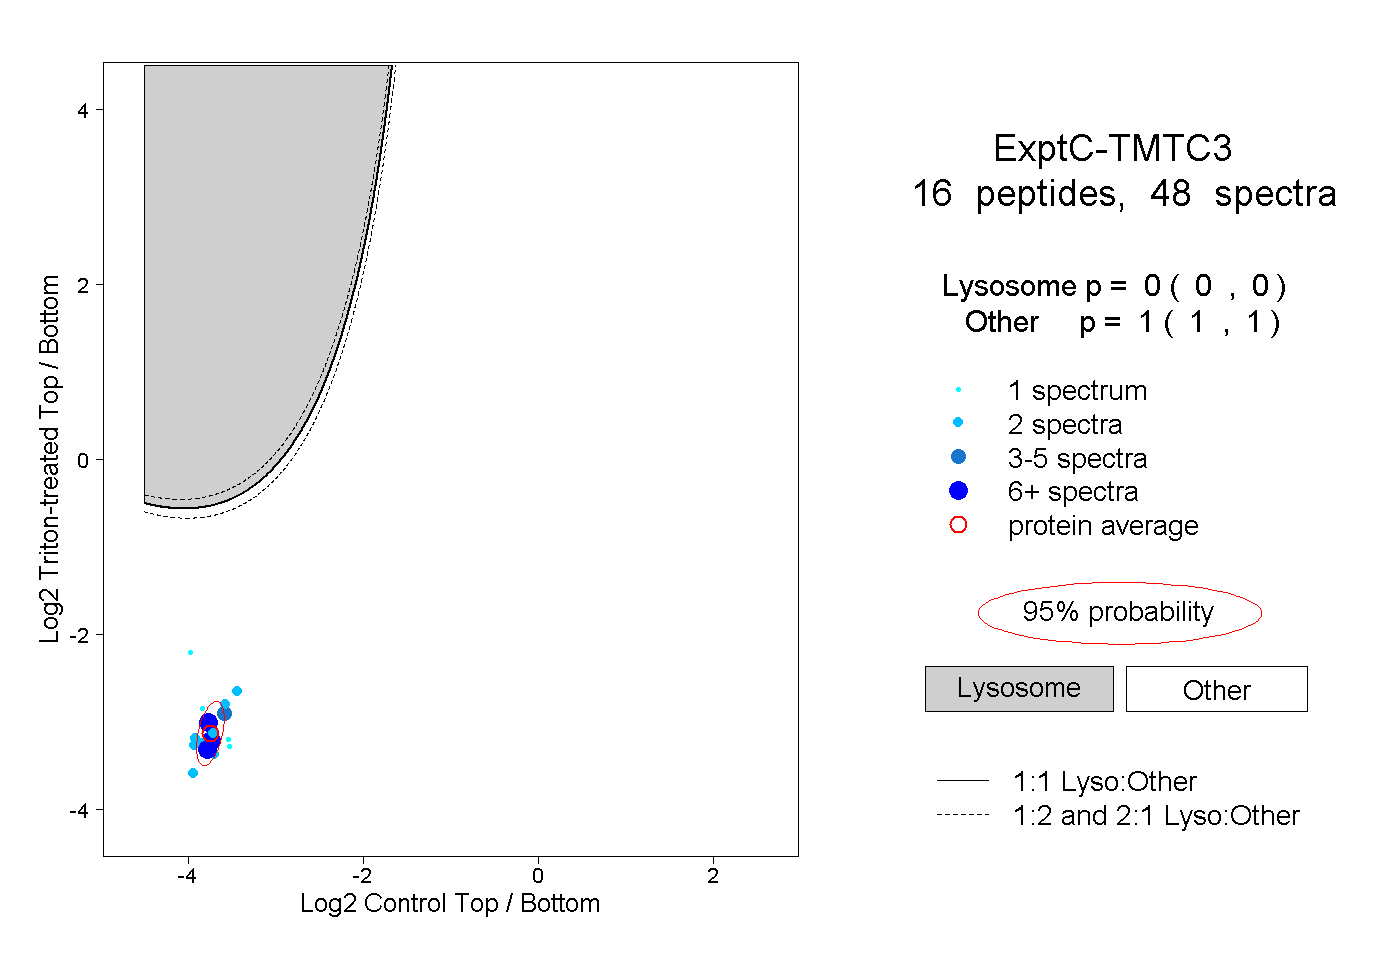
0.000 | 0.000
1.000 | 1.000
3peptides
spectra
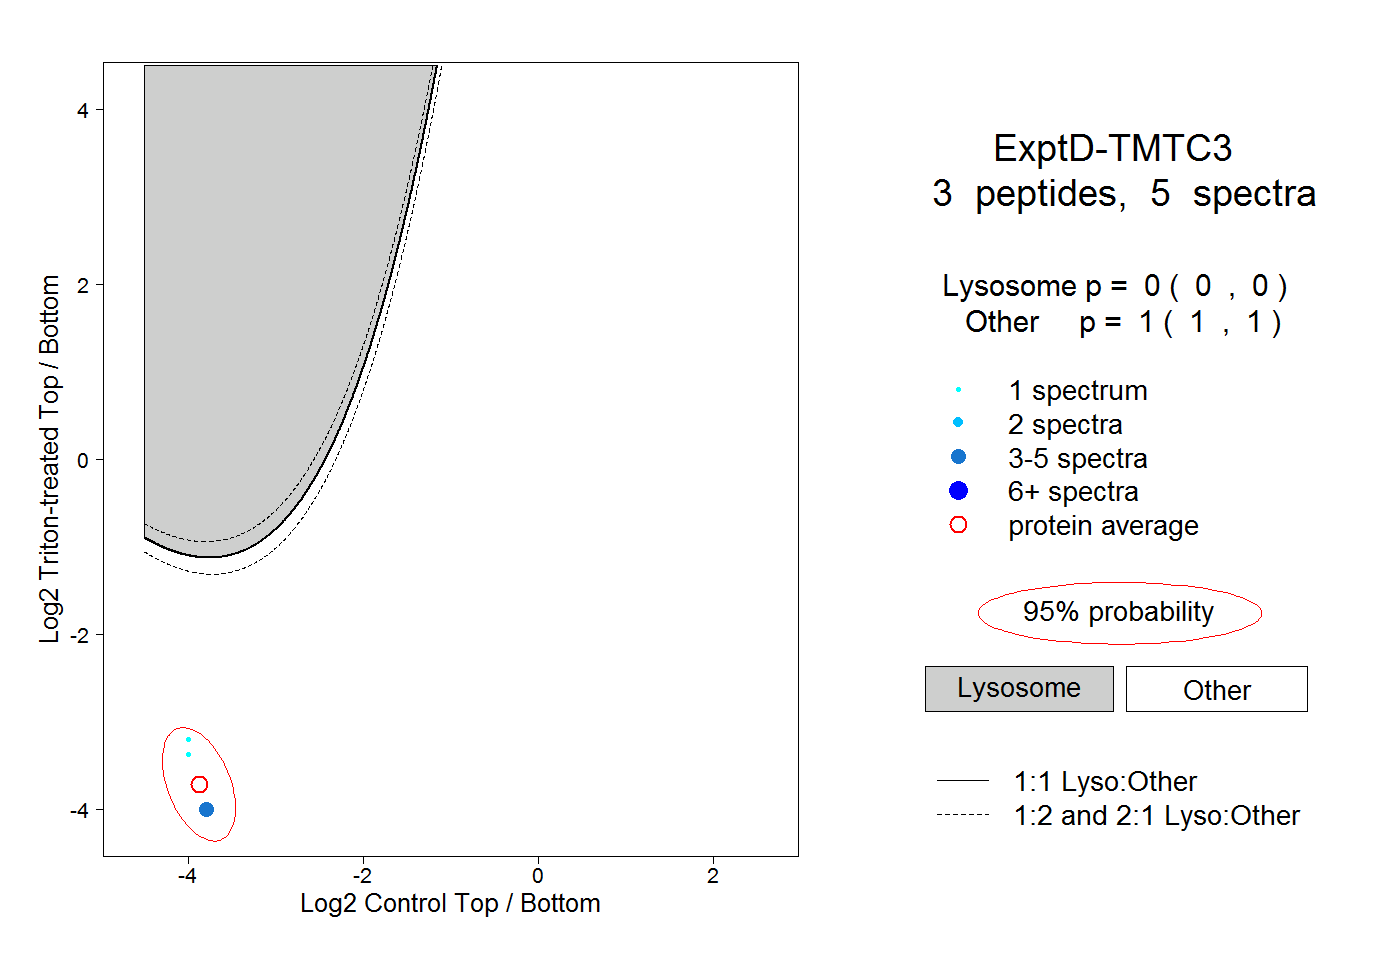
0.000 | 0.000
1.000 | 1.000