 13
13peptides
spectra
0.010 | 0.029
0.000 | 0.000
0.096 | 0.130
0.852 | 0.877
0.000 | 0.000
0.000 | 0.000
0.000 | 0.000
0.000 | 0.000
| Plot | Mito | Lyso | Perox | ER | Golgi | PM | Cytosol | Nucleus | |||||
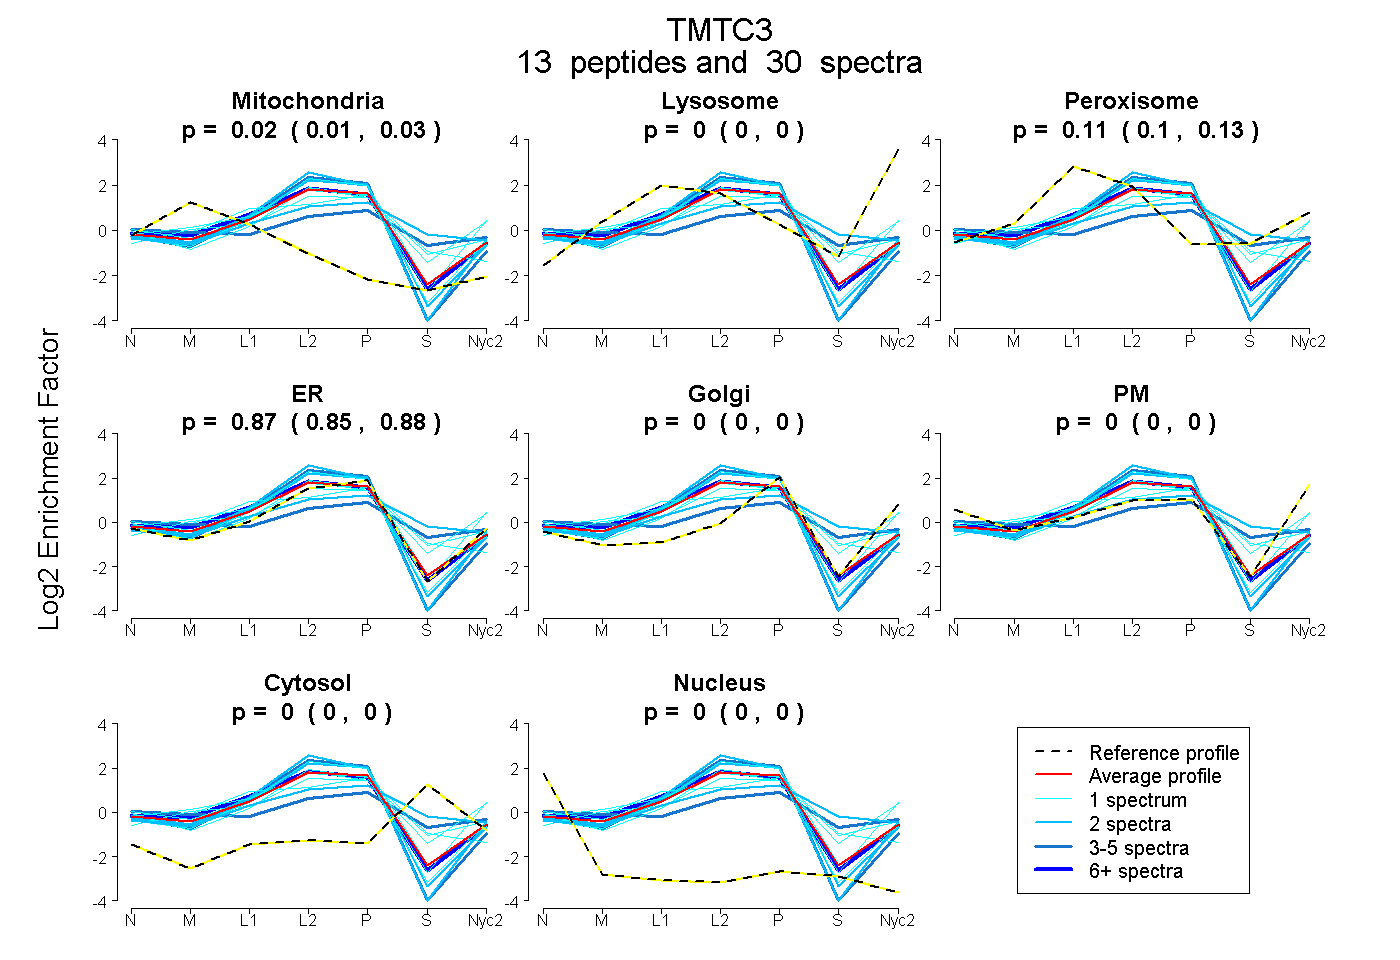
| Expt A |
13 peptides |
30 spectra |
|
0.020 0.010 | 0.029 |
0.000 0.000 | 0.000 |
0.114 0.096 | 0.130 |
0.866 0.852 | 0.877 |
0.000 0.000 | 0.000 |
0.000 0.000 | 0.000 |
0.000 0.000 | 0.000 |
0.000 0.000 | 0.000 |
| 1 spectrum, LQPDFR | 0.000 | 0.000 | 0.237 | 0.655 | 0.000 | 0.000 | 0.108 | 0.000 | ||
| 1 spectrum, TLFQNDFWGTPMSEER | 0.000 | 0.000 | 0.079 | 0.921 | 0.000 | 0.000 | 0.000 | 0.000 | ||
| 3 spectra, HNLCVVYFEEK | 0.073 | 0.000 | 0.152 | 0.371 | 0.068 | 0.113 | 0.223 | 0.000 | ||
| 1 spectrum, HLSIVR | 0.030 | 0.015 | 0.112 | 0.535 | 0.000 | 0.307 | 0.000 | 0.000 | ||
| 2 spectra, FDNPAAVSPTPTR | 0.000 | 0.000 | 0.000 | 1.000 | 0.000 | 0.000 | 0.000 | 0.000 | ||
| 1 spectrum, LWNNVGHALENEK | 0.000 | 0.008 | 0.243 | 0.571 | 0.000 | 0.158 | 0.020 | 0.000 | ||
| 2 spectra, LEEADQLYR | 0.000 | 0.000 | 0.000 | 1.000 | 0.000 | 0.000 | 0.000 | 0.000 | ||
| 1 spectrum, QAISMRPDFK | 0.077 | 0.000 | 0.063 | 0.860 | 0.000 | 0.000 | 0.000 | 0.000 | ||
| 2 spectra, GELLLK | 0.000 | 0.000 | 0.000 | 1.000 | 0.000 | 0.000 | 0.000 | 0.000 | ||
| 1 spectrum, ILEMDPSNVQGK | 0.000 | 0.000 | 0.111 | 0.740 | 0.000 | 0.000 | 0.148 | 0.000 | ||
| 2 spectra, YYPDHTK | 0.000 | 0.000 | 0.240 | 0.499 | 0.000 | 0.000 | 0.261 | 0.000 | ||
| 4 spectra, ALPILEELLR | 0.000 | 0.000 | 0.000 | 1.000 | 0.000 | 0.000 | 0.000 | 0.000 | ||
| 9 spectra, DSEAETWMK | 0.039 | 0.000 | 0.126 | 0.835 | 0.000 | 0.000 | 0.000 | 0.000 |
| Plot | Mito | Lyso or Perox | ER | Golgi | PM | Cytosol | Nucleus | ||||||
| Expt B |
4 peptides |
9 spectra |
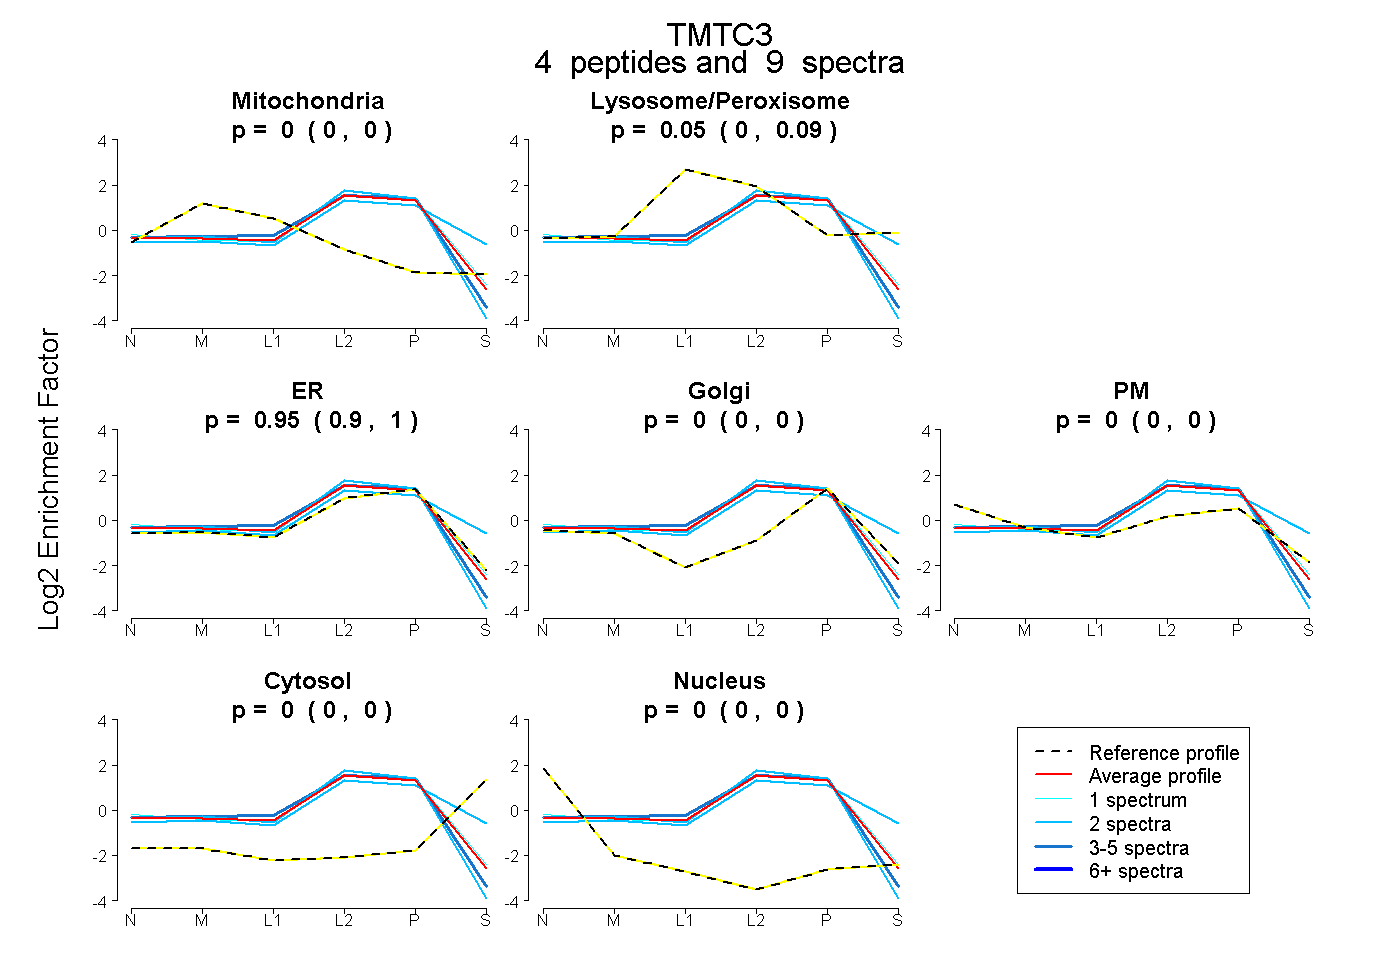 |
0.000 0.000 | 0.000 |
0.049 0.000 | 0.091 |
0.951 0.898 | 0.999 |
0.000 0.000 | 0.000 |
0.000 0.000 | 0.000 |
0.000 0.000 | 0.000 |
0.000 0.000 | 0.000 |
|||
| Plot | Lyso | Other | |||||||||||
| Expt C |
16 peptides |
48 spectra |
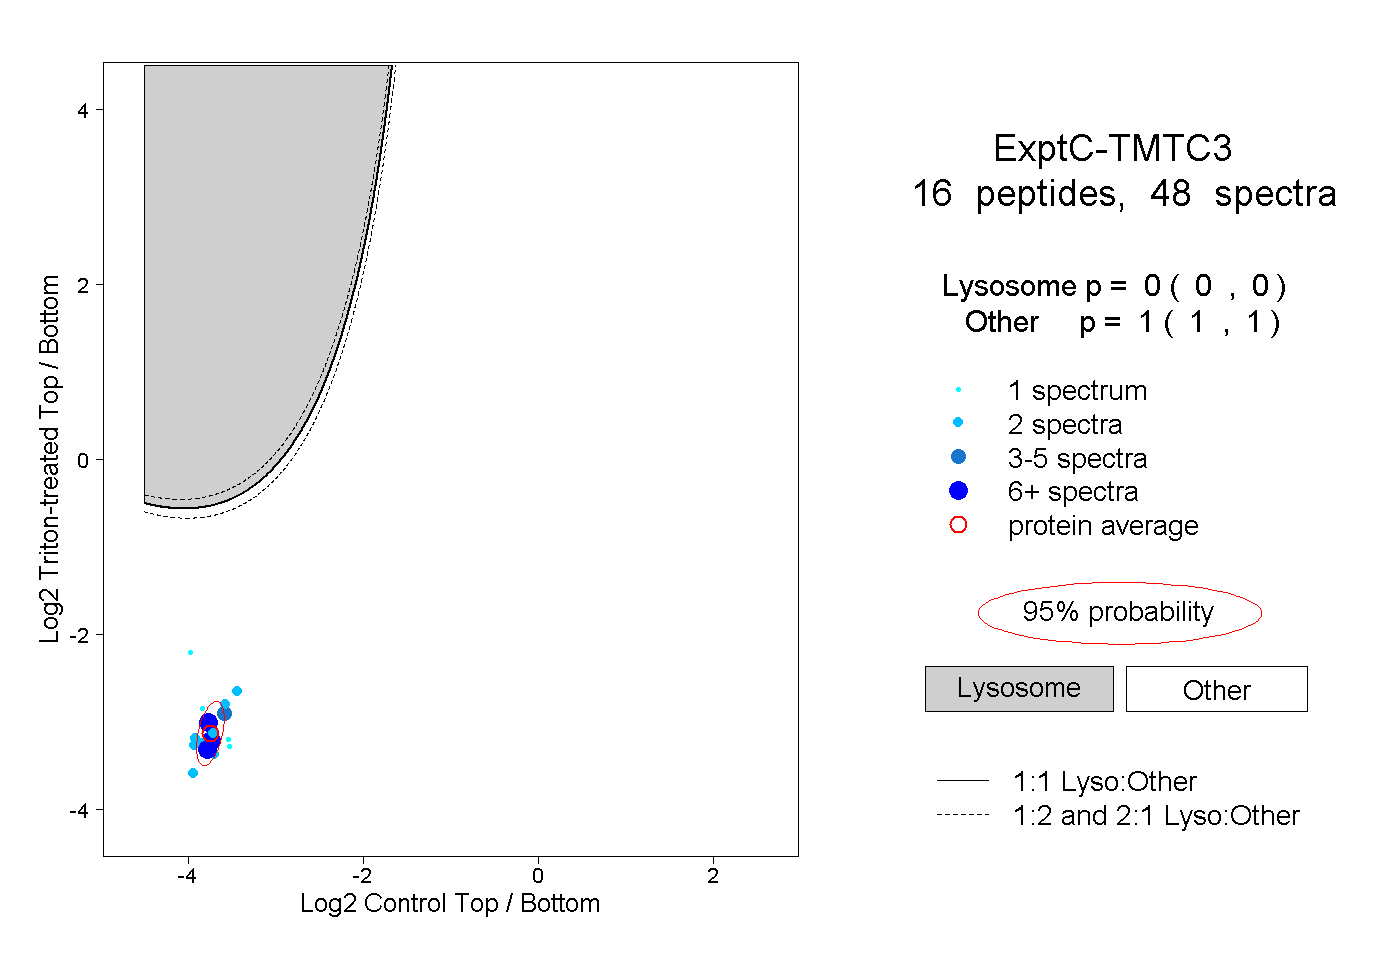 |
0.000 0.000 | 0.000 |
1.000 1.000 | 1.000 |
||||||||
| Plot | Lyso | Other | |||||||||||
| Expt D |
3 peptides |
5 spectra |
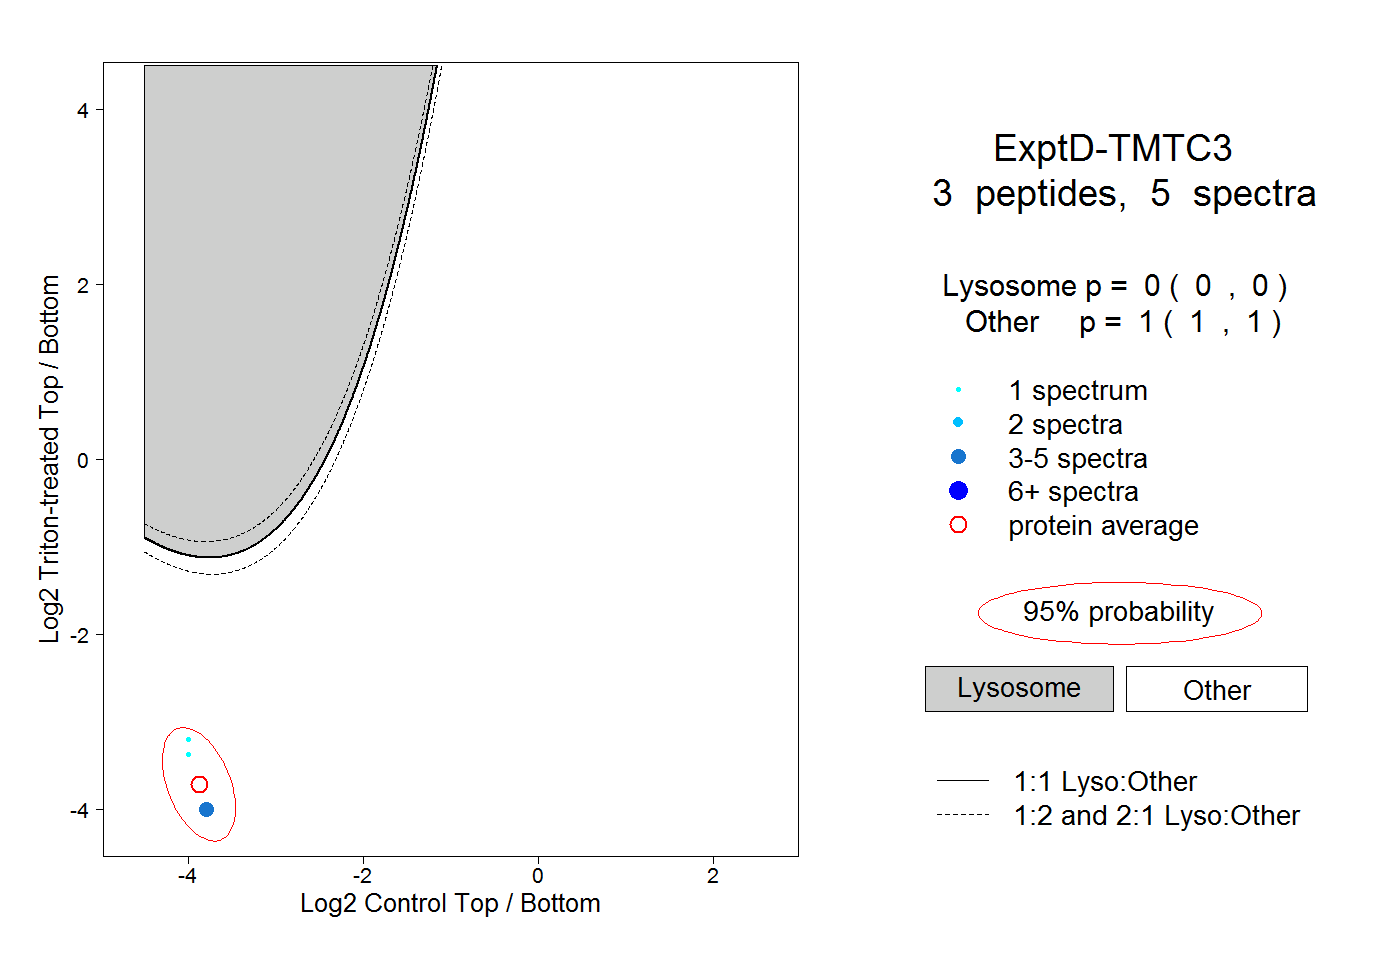 |
0.000 0.000 | 0.000 |
1.000 1.000 | 1.000 |