 3
3peptides
spectra
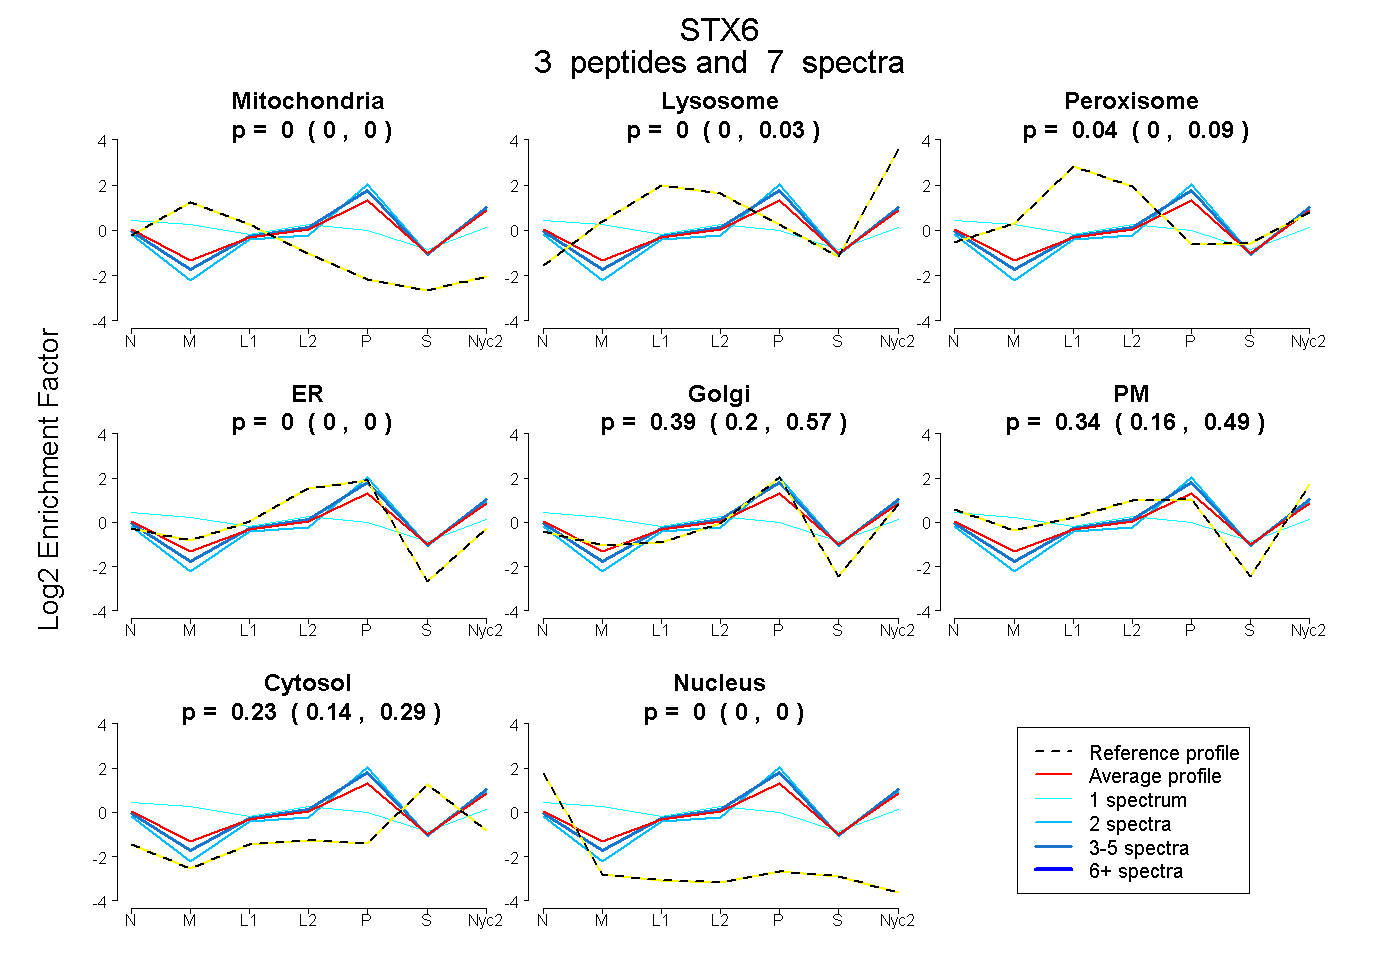
0.000 | 0.000
0.000 | 0.029
0.000 | 0.085
0.000 | 0.001
0.199 | 0.570
0.162 | 0.486
0.144 | 0.286
0.000 | 0.000
3peptides
spectra
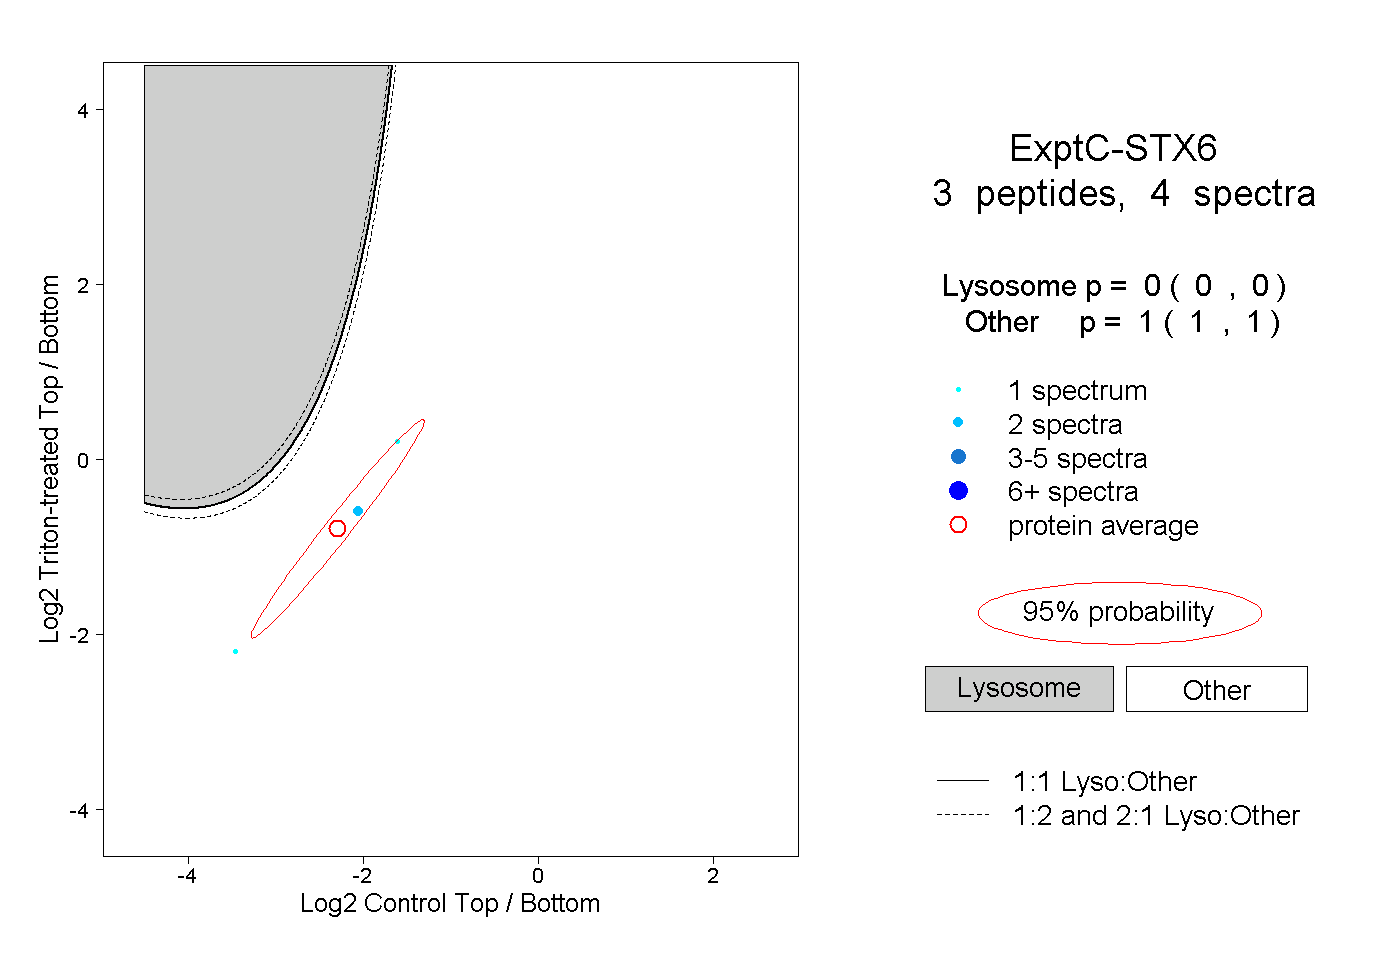
0.000 | 0.000
1.000 | 1.000
1peptide
spectrum
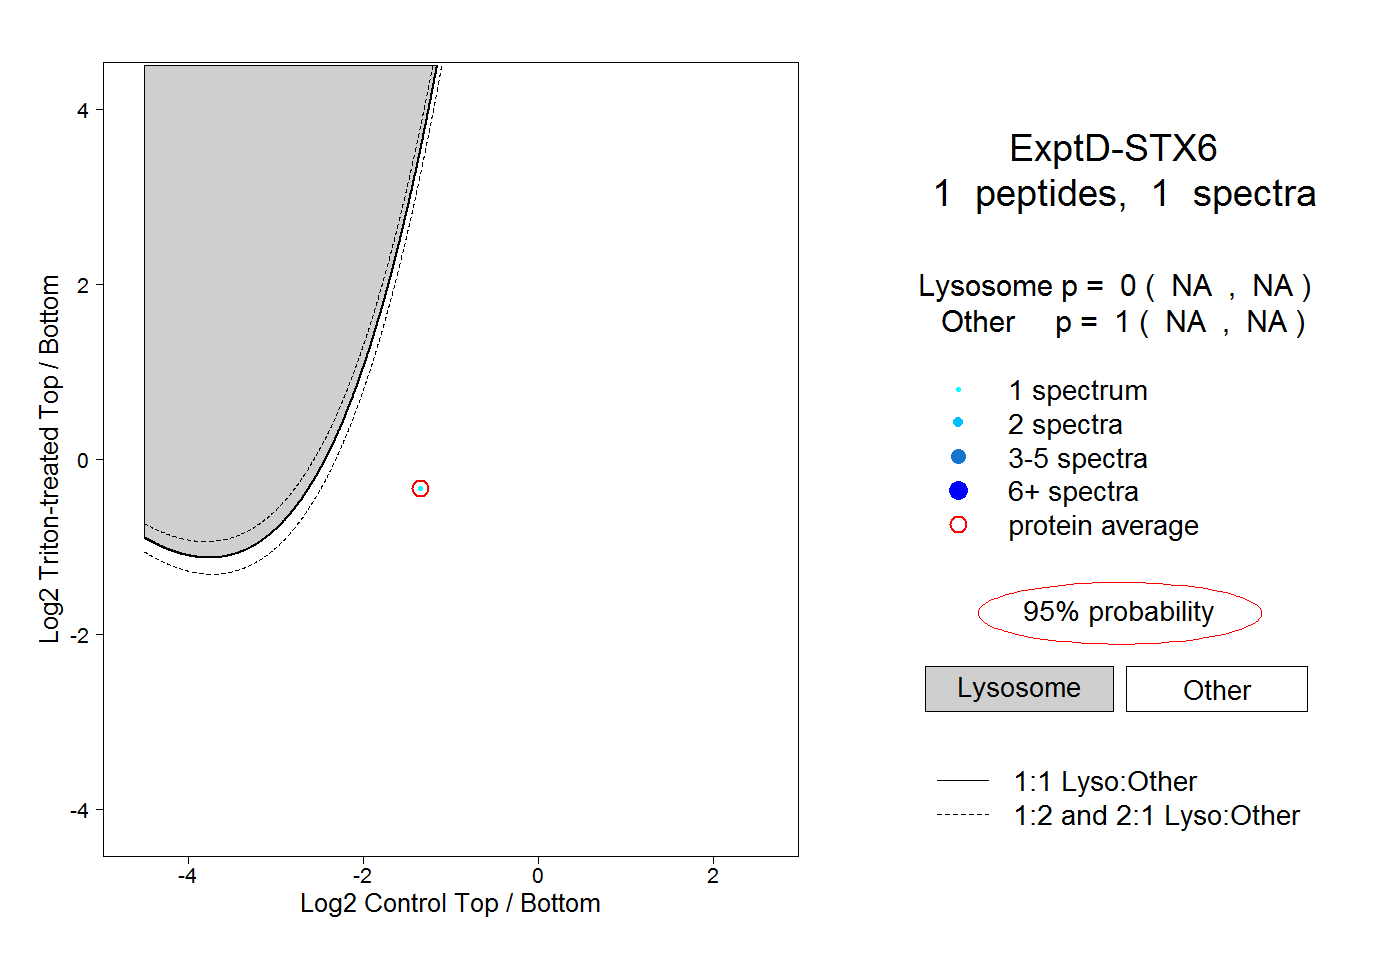
NA | NA
NA | NA