 3
3peptides
spectra
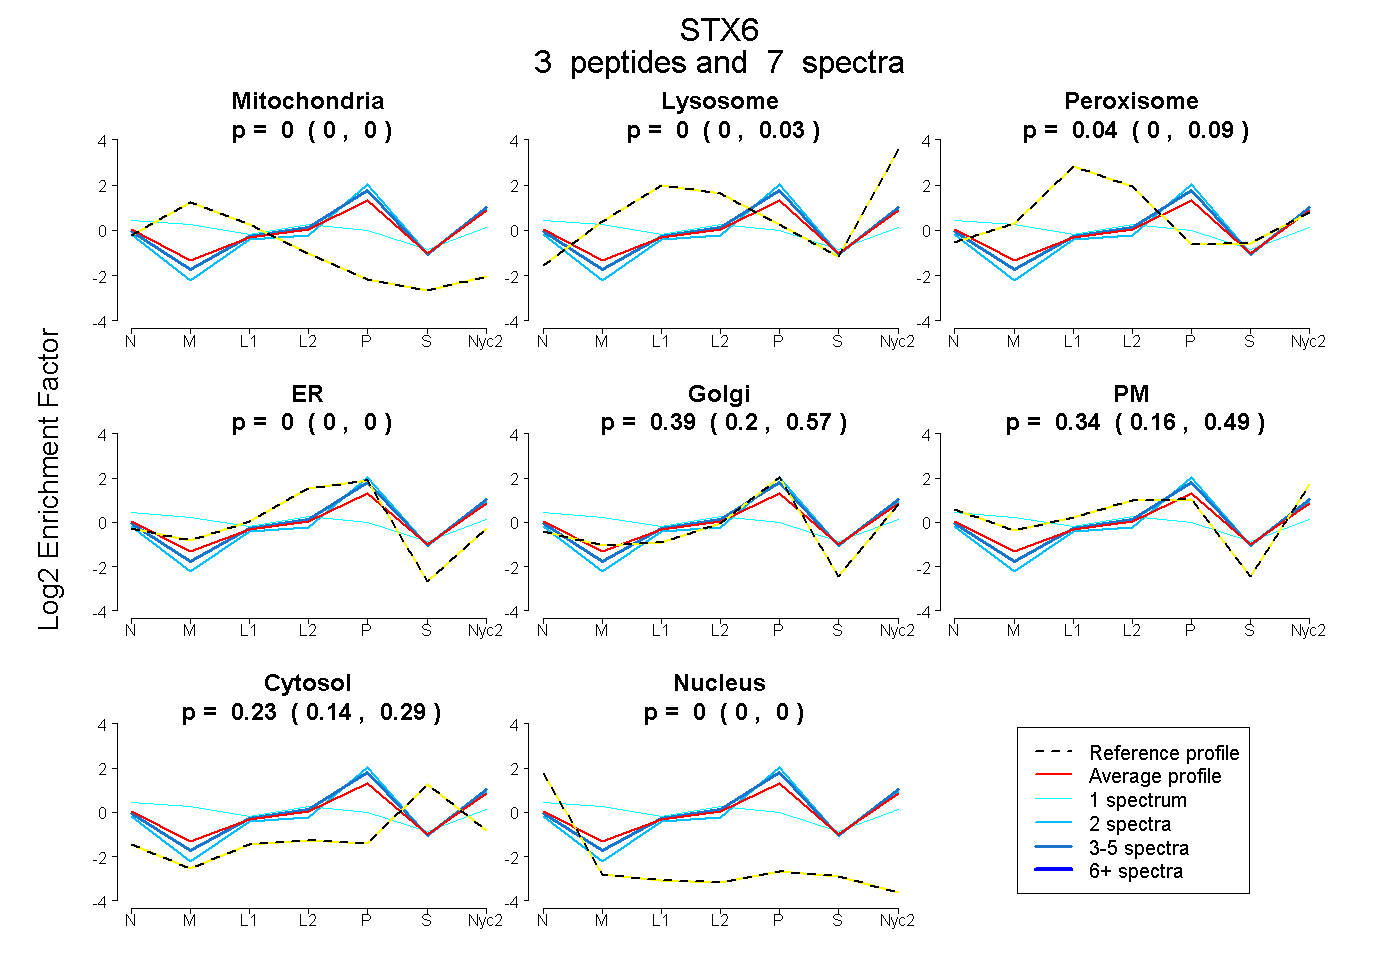
0.000 | 0.000
0.000 | 0.029
0.000 | 0.085
0.000 | 0.001
0.199 | 0.570
0.162 | 0.486
0.144 | 0.286
0.000 | 0.000
| Plot | Mito | Lyso | Perox | ER | Golgi | PM | Cytosol | Nucleus | |||||
| Expt A |
3 peptides |
7 spectra |
|
0.000 0.000 | 0.000 |
0.000 0.000 | 0.029 |
0.037 0.000 | 0.085 |
0.000 0.000 | 0.001 |
0.392 0.199 | 0.570 |
0.345 0.162 | 0.486 |
0.226 0.144 | 0.286 |
0.000 0.000 | 0.000 |
| 4 spectra, EEIDWTTNELR | 0.000 | 0.047 | 0.011 | 0.000 | 0.575 | 0.189 | 0.178 | 0.000 | ||
| 1 spectrum, DQMSASSVQALAER | 0.211 | 0.000 | 0.097 | 0.000 | 0.000 | 0.483 | 0.209 | 0.000 | ||
| 2 spectra, AFITSTR | 0.000 | 0.037 | 0.000 | 0.000 | 0.769 | 0.000 | 0.194 | 0.000 |
| Plot | Lyso | Other | |||||||||||
| Expt C |
3 peptides |
4 spectra |
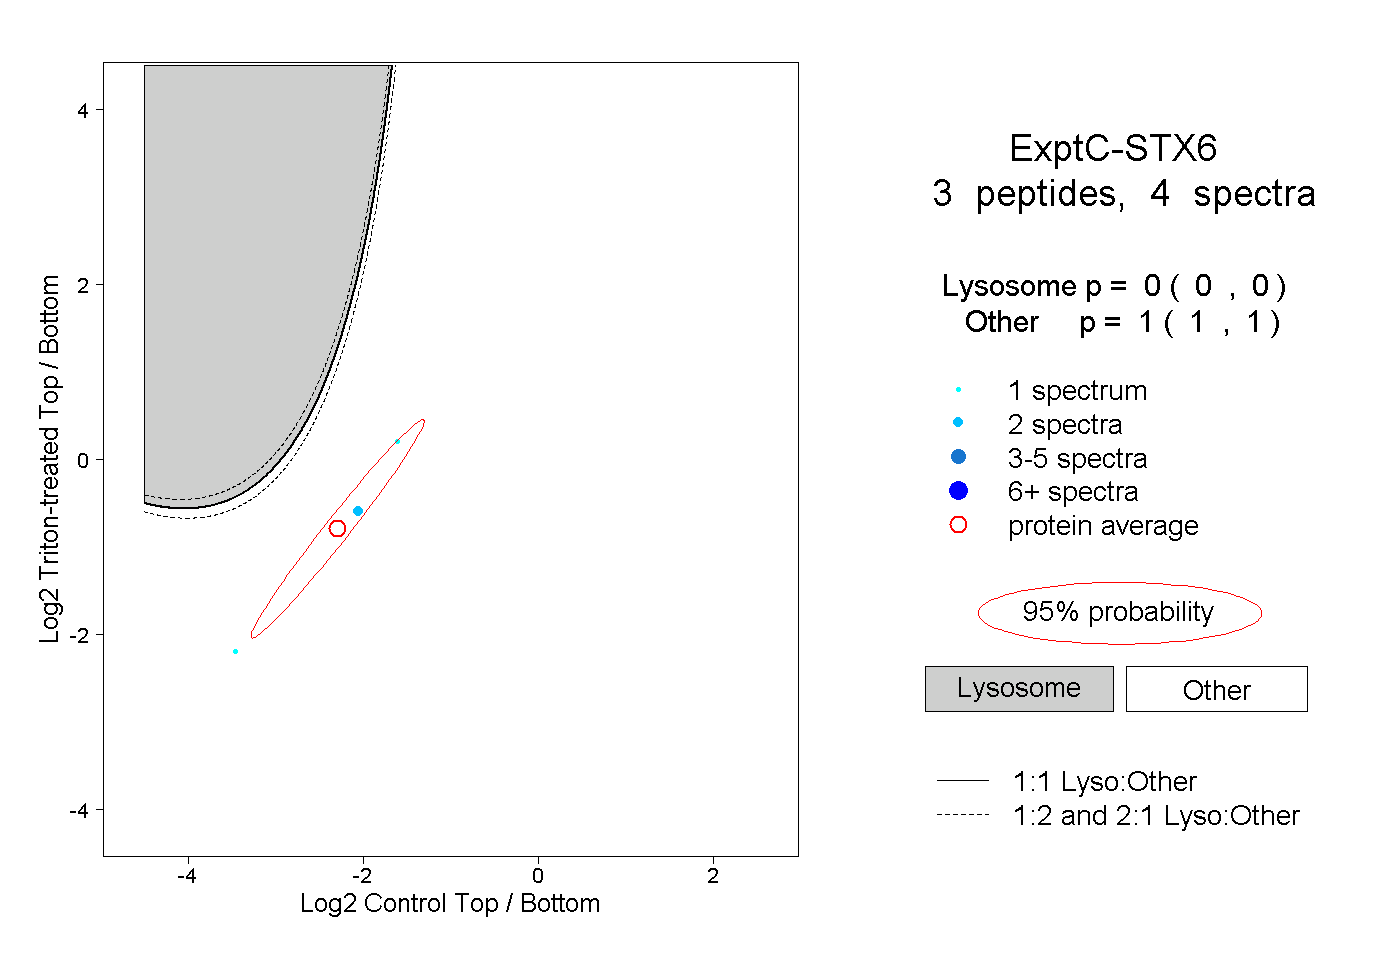 |
0.000 0.000 | 0.000 |
1.000 1.000 | 1.000 |
||||||||
| Plot | Lyso | Other | |||||||||||
| Expt D |
1 peptide |
1 spectrum |
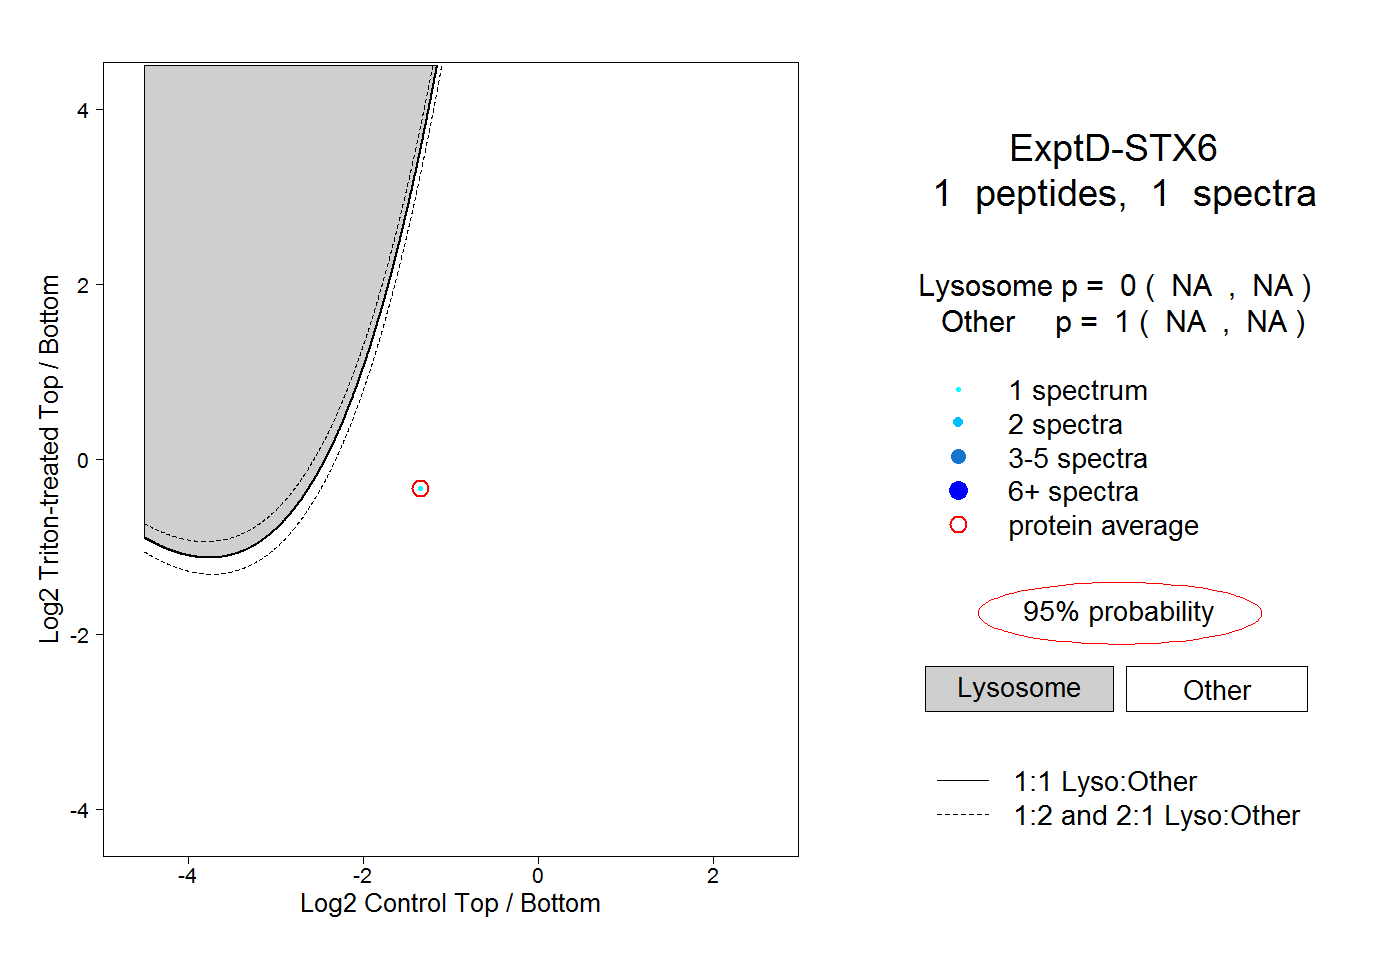 |
0.000 NA | NA |
1.000 NA | NA |