 4
4peptides
spectra
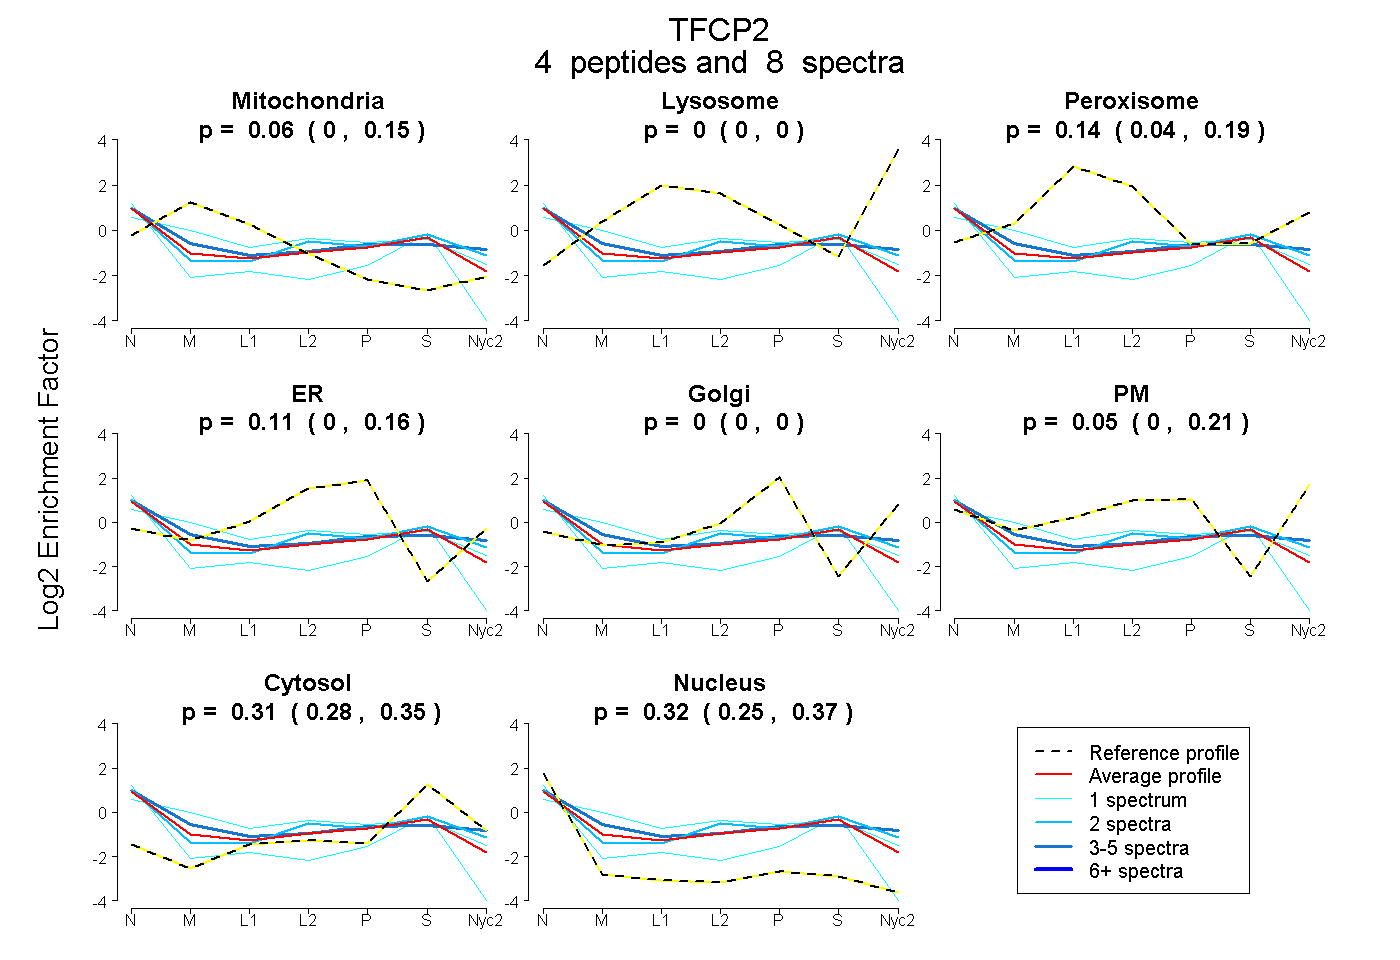
0.000 | 0.152
0.000 | 0.000
0.040 | 0.189
0.000 | 0.165
0.000 | 0.000
0.000 | 0.208
0.282 | 0.351
0.246 | 0.369
1peptide
spectrum
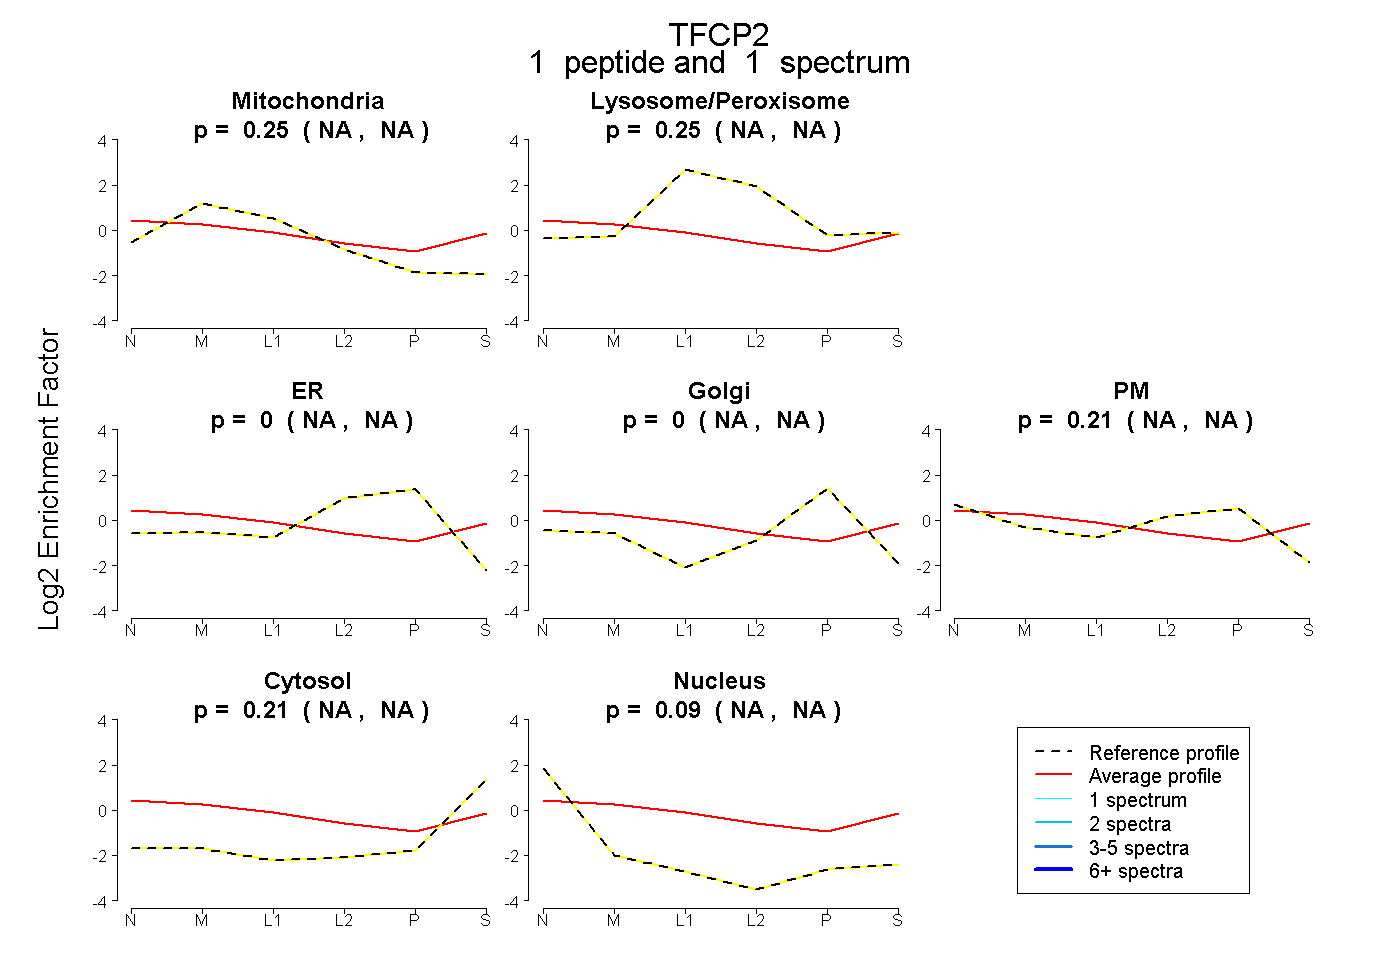
NA | NA
NA | NA
NA | NA
NA | NA
NA | NA
NA | NA
NA | NA
2peptides
spectra
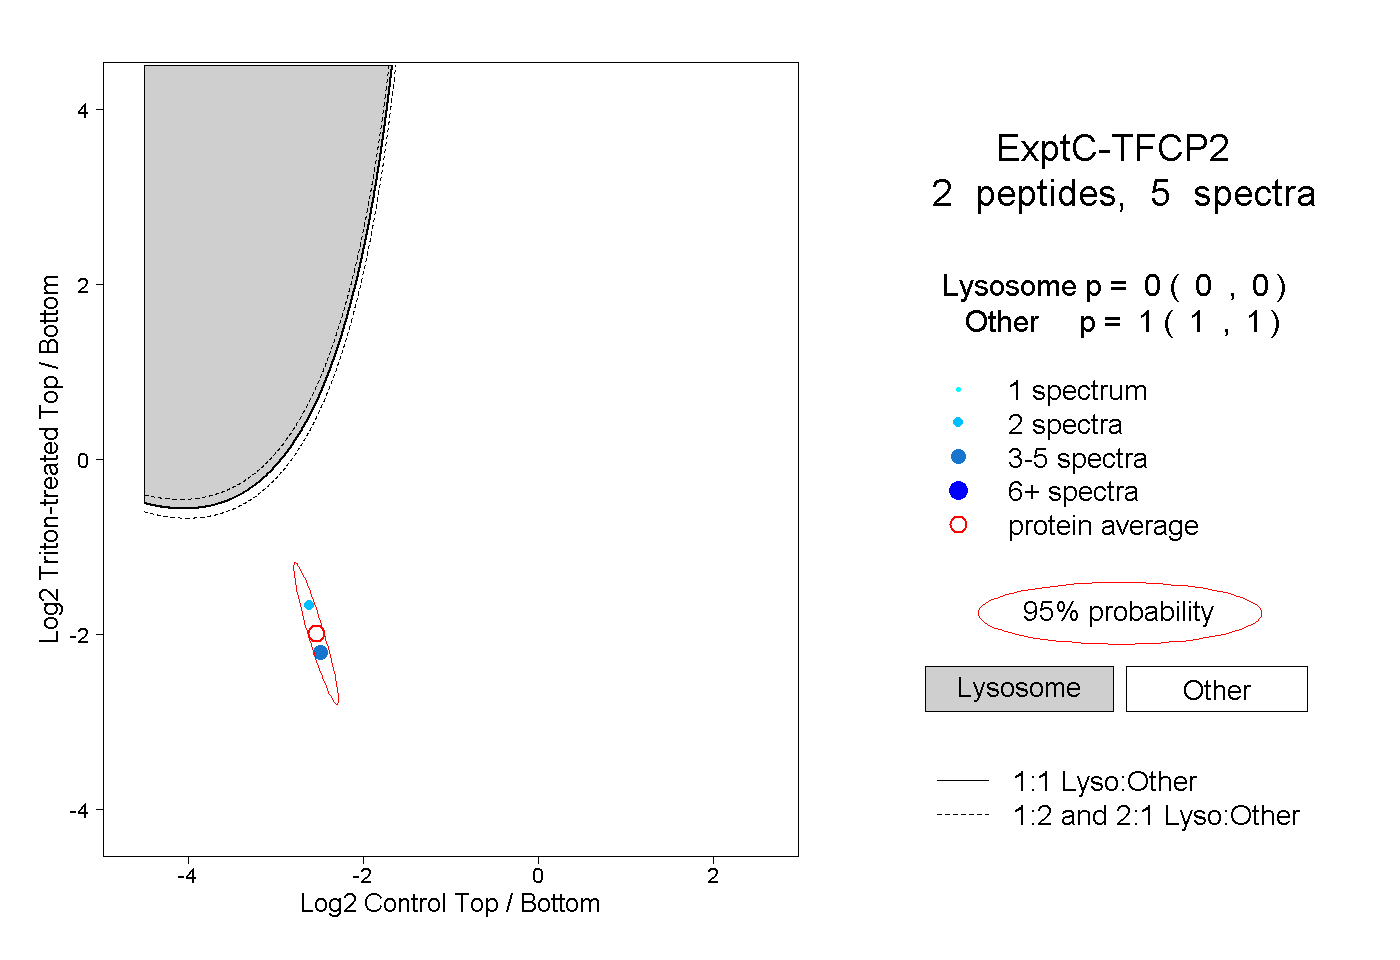
0.000 | 0.000
1.000 | 1.000