 4
4peptides
spectra
0.000 | 0.152
0.000 | 0.000
0.040 | 0.189
0.000 | 0.165
0.000 | 0.000
0.000 | 0.208
0.282 | 0.351
0.246 | 0.369
| Plot | Mito | Lyso | Perox | ER | Golgi | PM | Cytosol | Nucleus | |||||
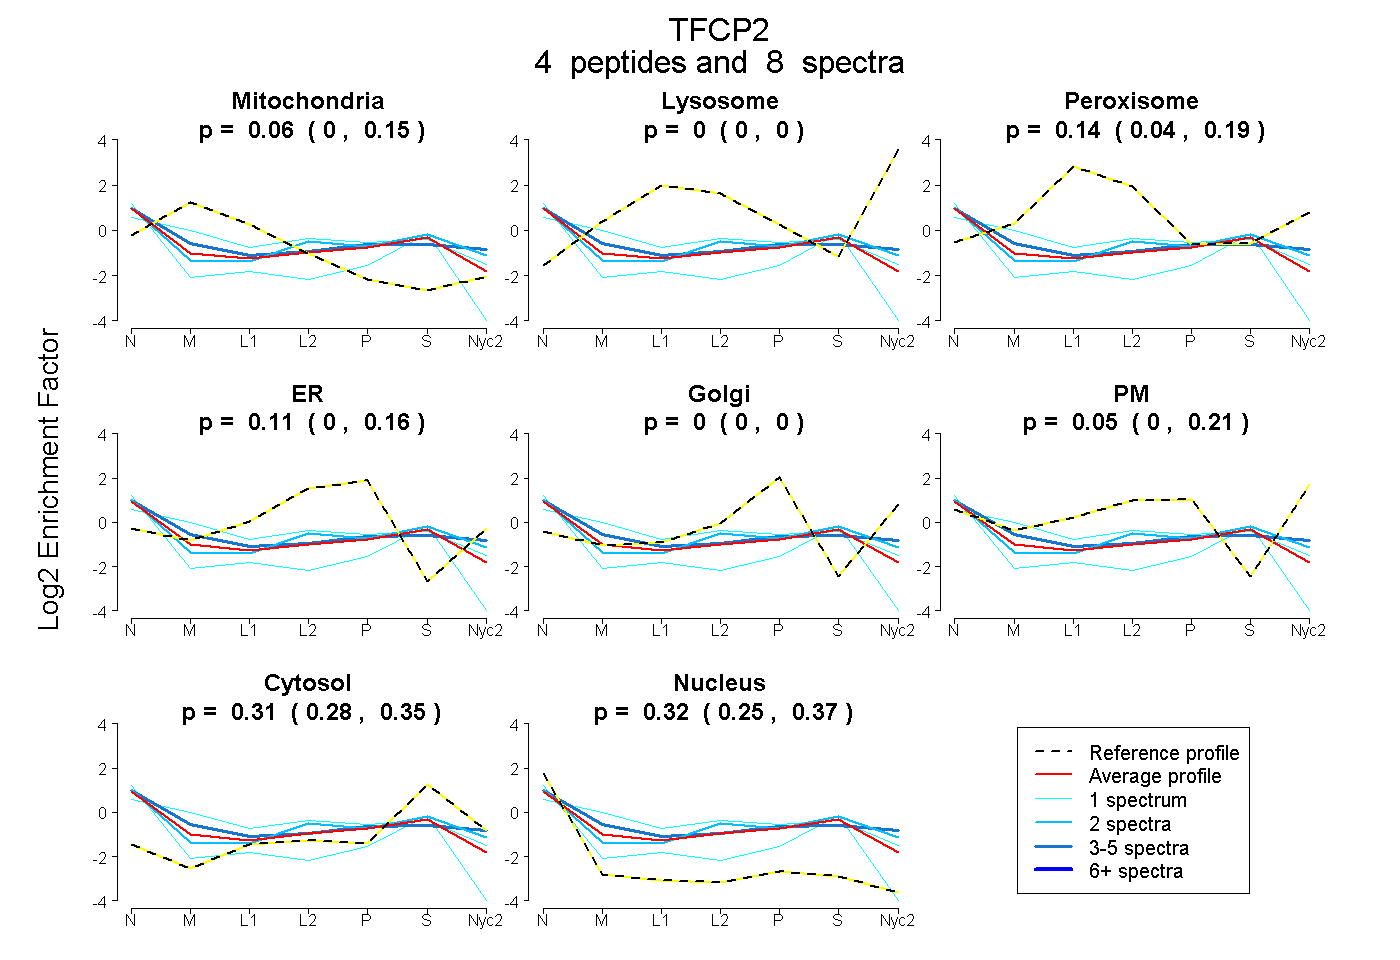
| Expt A |
4 peptides |
8 spectra |
|
0.064 0.000 | 0.152 |
0.000 0.000 | 0.000 |
0.139 0.040 | 0.189 |
0.113 0.000 | 0.165 |
0.000 0.000 | 0.000 |
0.046 0.000 | 0.208 |
0.314 0.282 | 0.351 |
0.324 0.246 | 0.369 |
| 2 spectra, VVFHDR | 0.000 | 0.000 | 0.100 | 0.006 | 0.000 | 0.251 | 0.371 | 0.272 | ||
| 4 spectra, FSTFTR | 0.164 | 0.000 | 0.000 | 0.000 | 0.000 | 0.342 | 0.307 | 0.186 | ||
| 1 spectrum, DDVIQICGPADGIR | 0.047 | 0.000 | 0.005 | 0.000 | 0.000 | 0.000 | 0.380 | 0.569 | ||
| 1 spectrum, EQPQQPQPQQK | 0.303 | 0.000 | 0.081 | 0.164 | 0.000 | 0.058 | 0.303 | 0.091 |
| Plot | Mito | Lyso or Perox | ER | Golgi | PM | Cytosol | Nucleus | ||||||
| Expt B |
1 peptide |
1 spectrum |
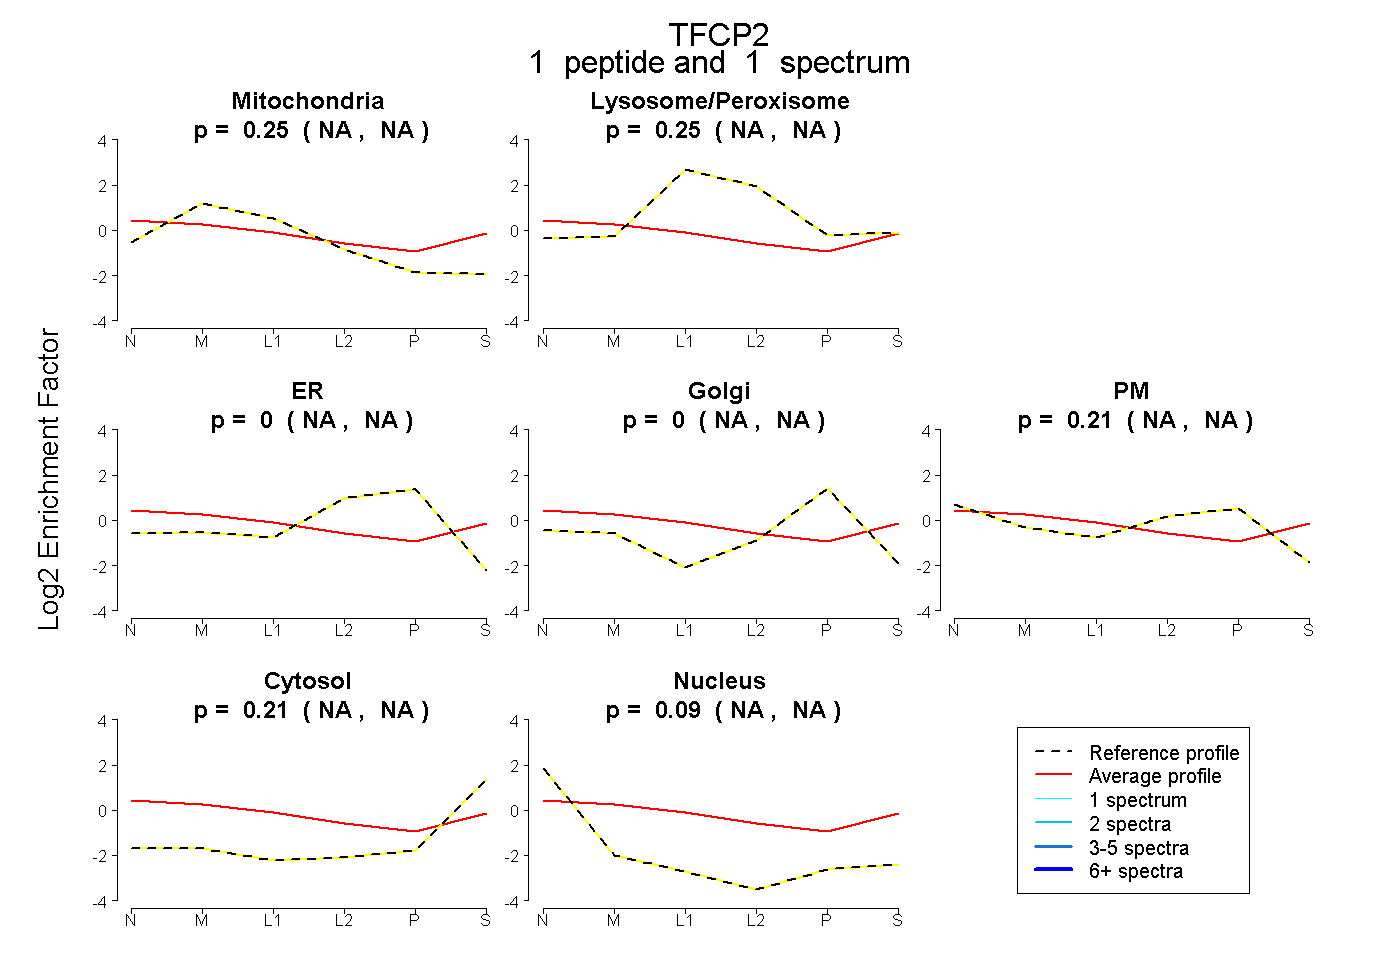 |
0.246 NA | NA |
0.251 NA | NA |
0.000 NA | NA |
0.000 NA | NA |
0.212 NA | NA |
0.205 NA | NA |
0.086 NA | NA |
|||
| Plot | Lyso | Other | |||||||||||
| Expt C |
2 peptides |
5 spectra |
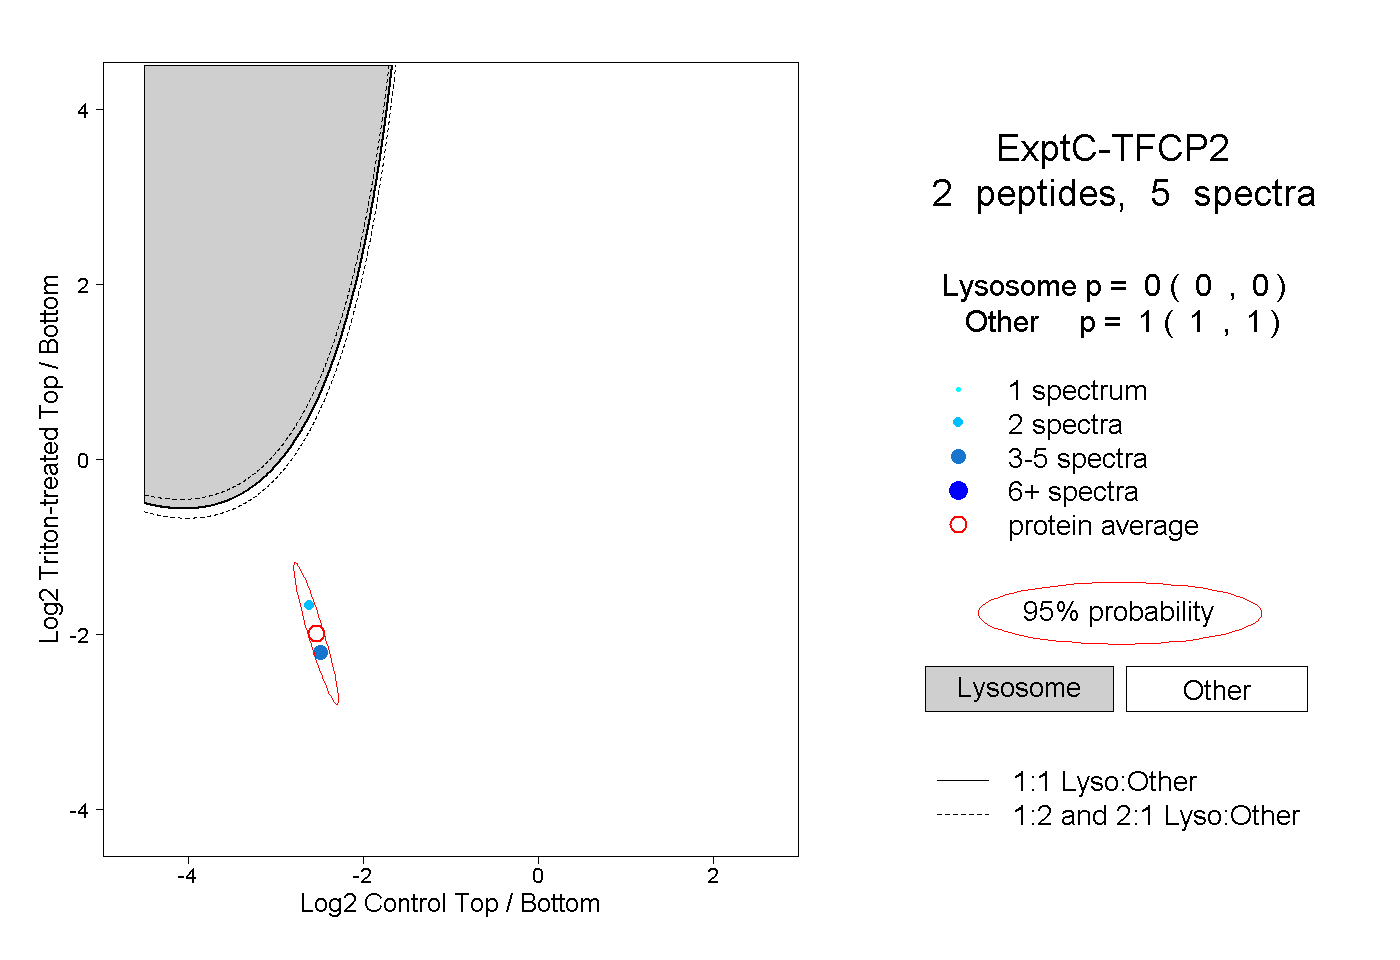 |
0.000 0.000 | 0.000 |
1.000 1.000 | 1.000 |