 4
4peptides
spectra
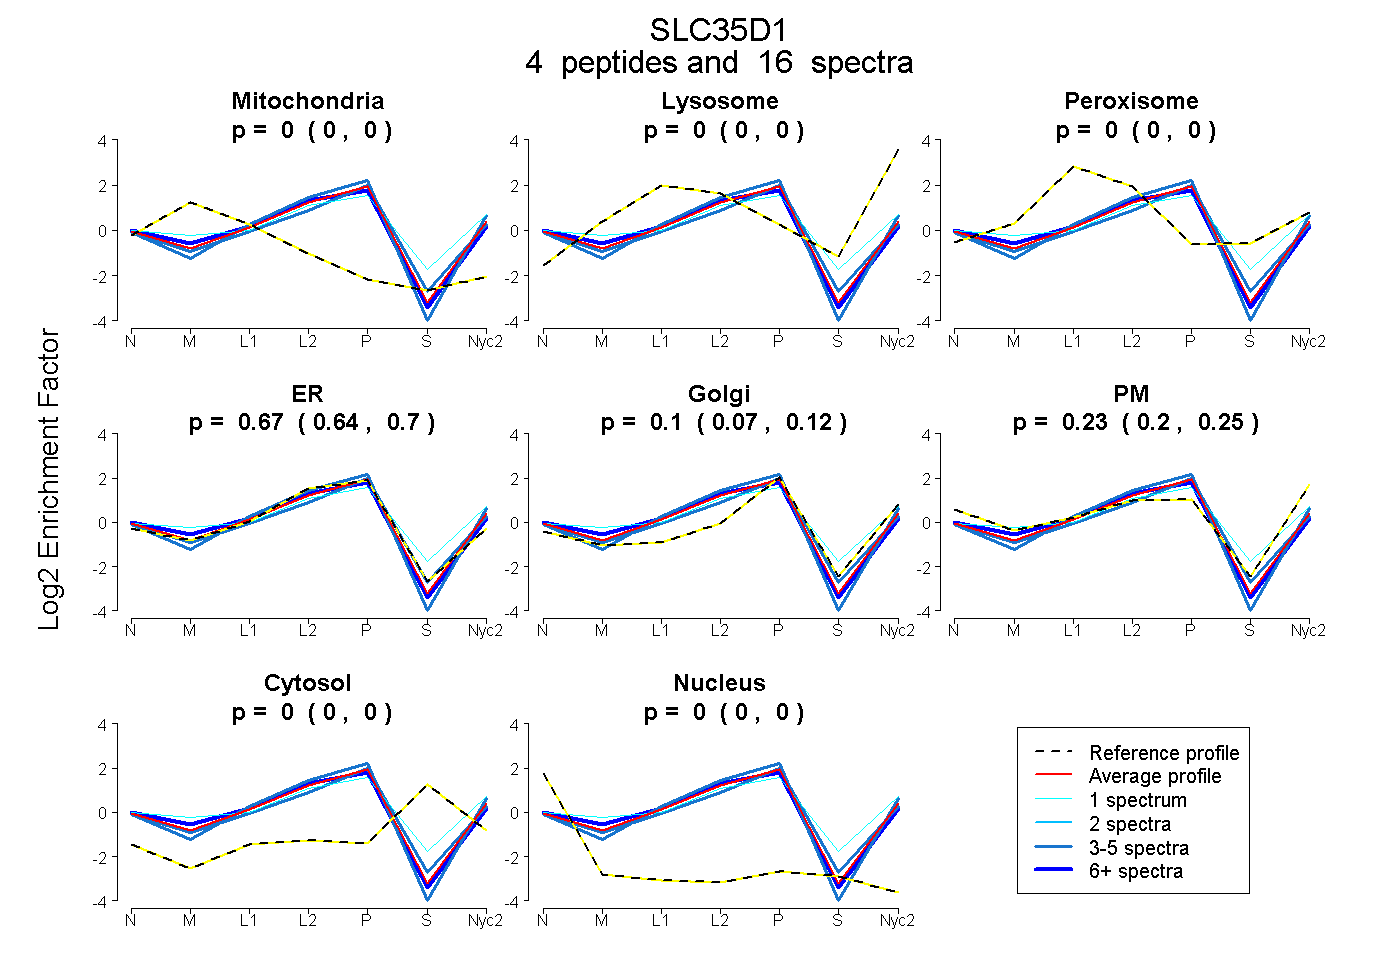
0.000 | 0.000
0.000 | 0.000
0.000 | 0.000
0.642 | 0.702
0.067 | 0.123
0.200 | 0.250
0.000 | 0.000
0.000 | 0.000
3peptides
spectra
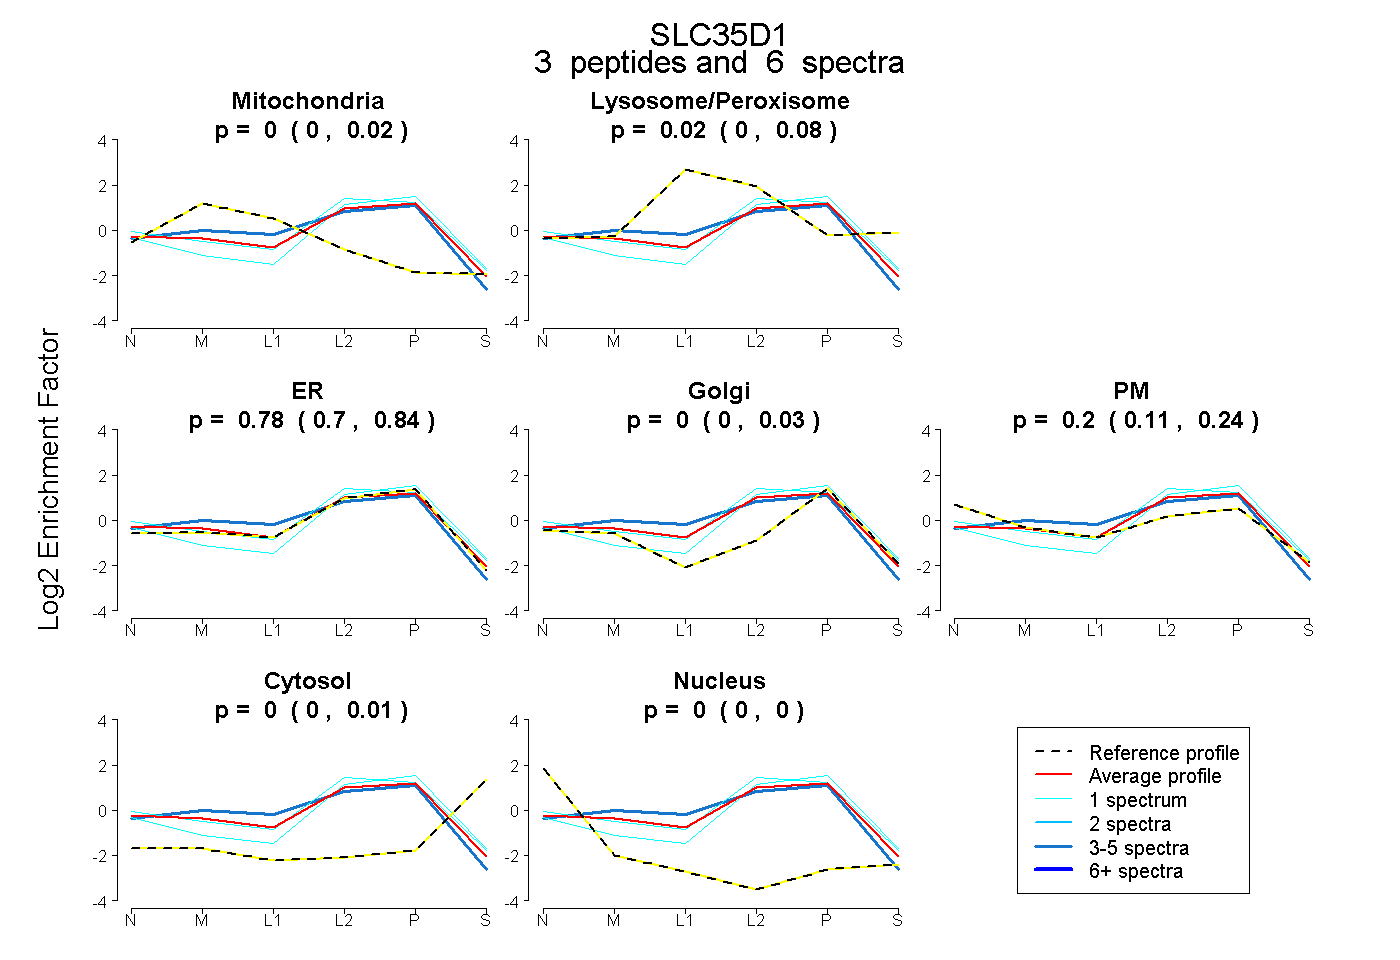
0.000 | 0.021
0.000 | 0.079
0.701 | 0.844
0.000 | 0.026
0.115 | 0.244
0.000 | 0.013
0.000 | 0.000
3peptides
spectra
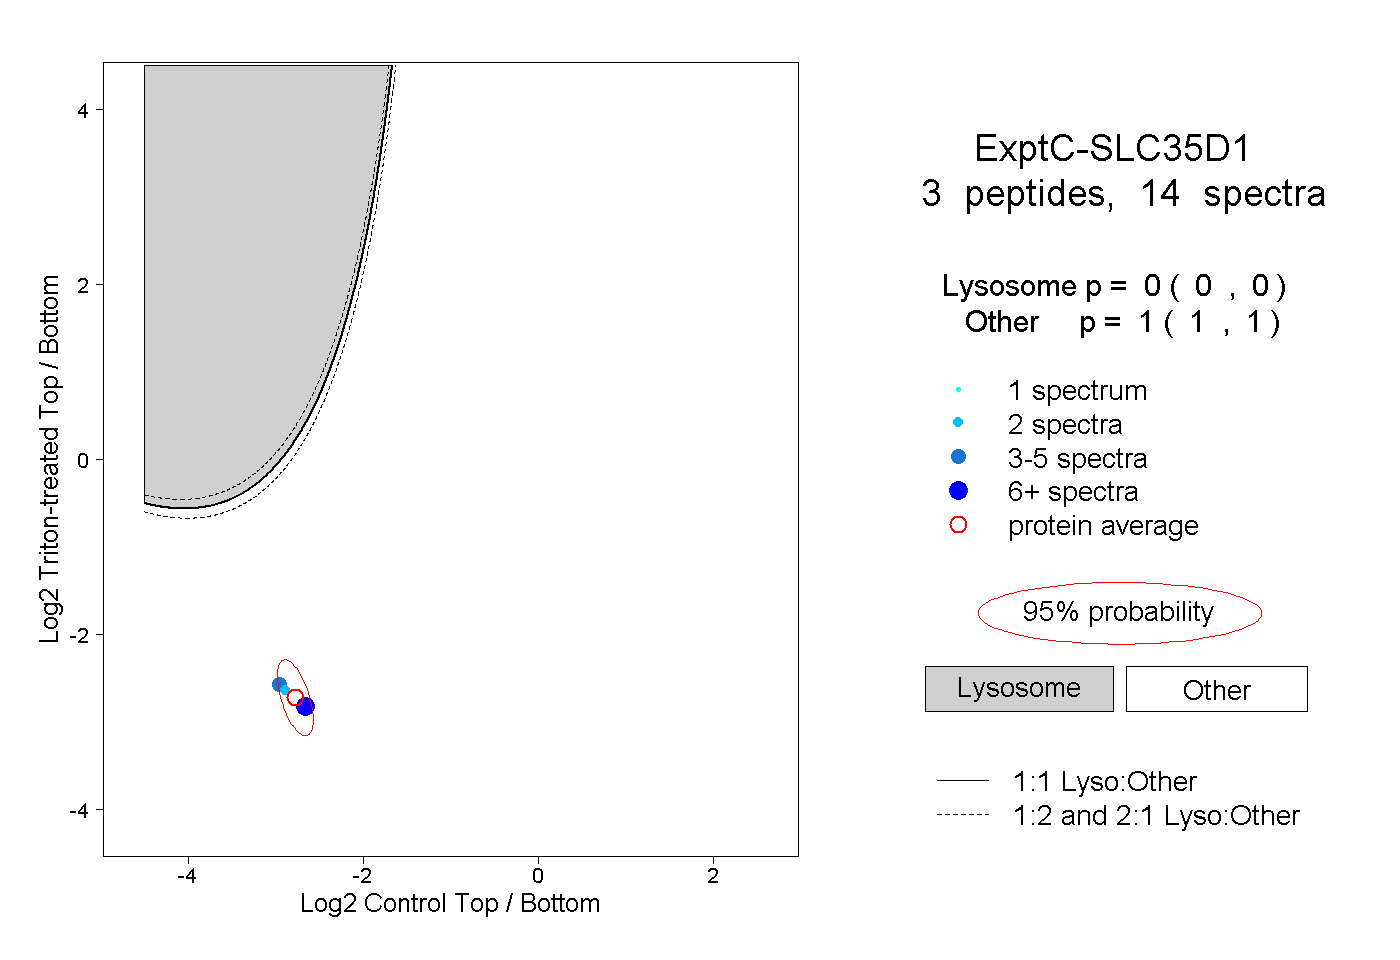
0.000 | 0.000
1.000 | 1.000
2peptides
spectra
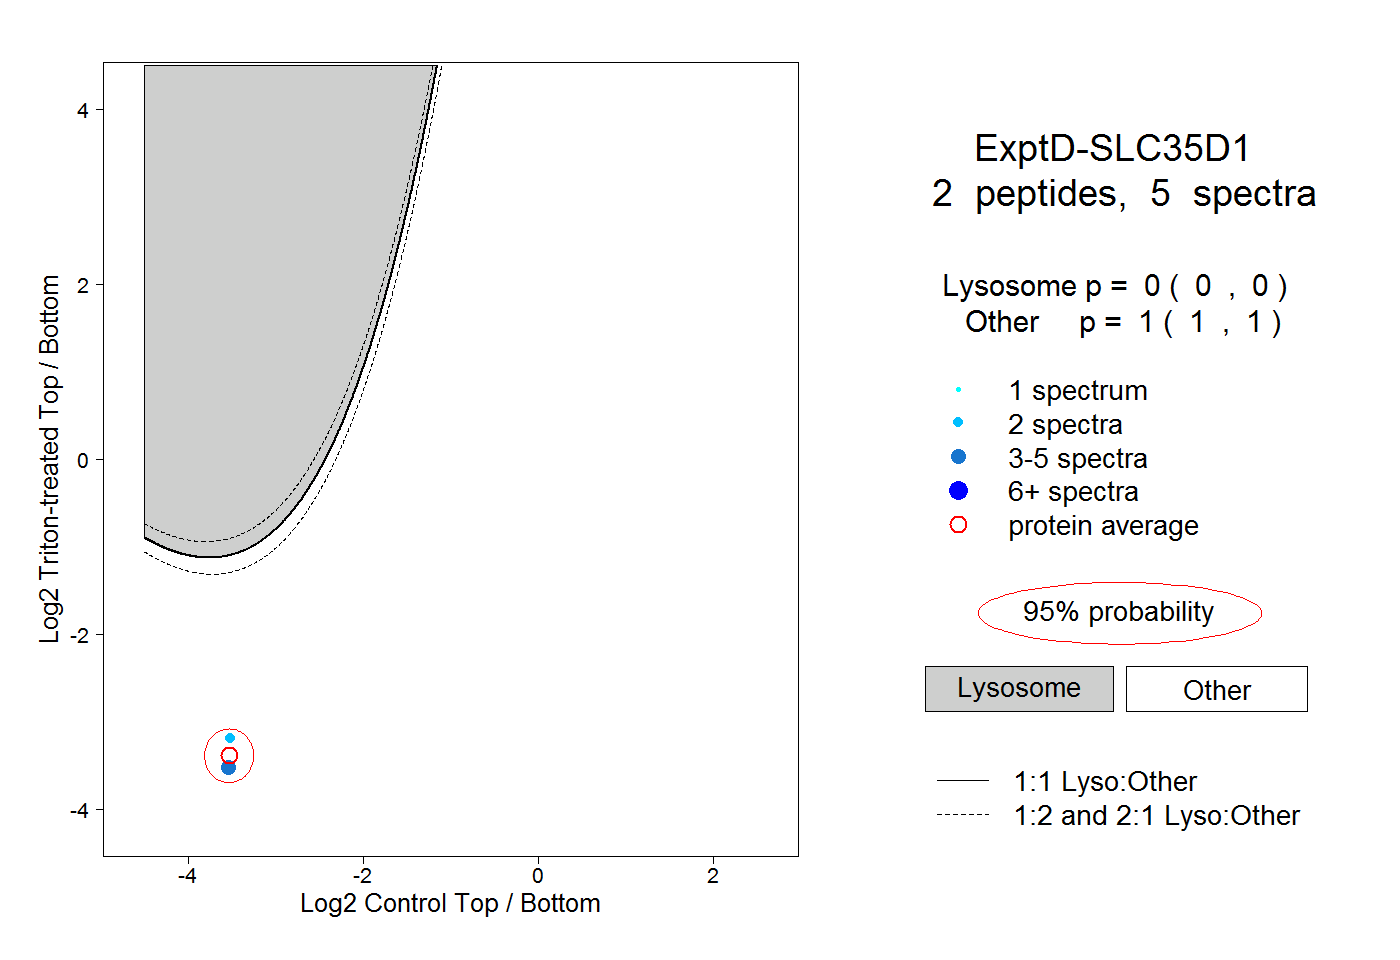
0.000 | 0.000
1.000 | 1.000