 4
4peptides
spectra
0.000 | 0.000
0.000 | 0.000
0.000 | 0.000
0.642 | 0.702
0.067 | 0.123
0.200 | 0.250
0.000 | 0.000
0.000 | 0.000
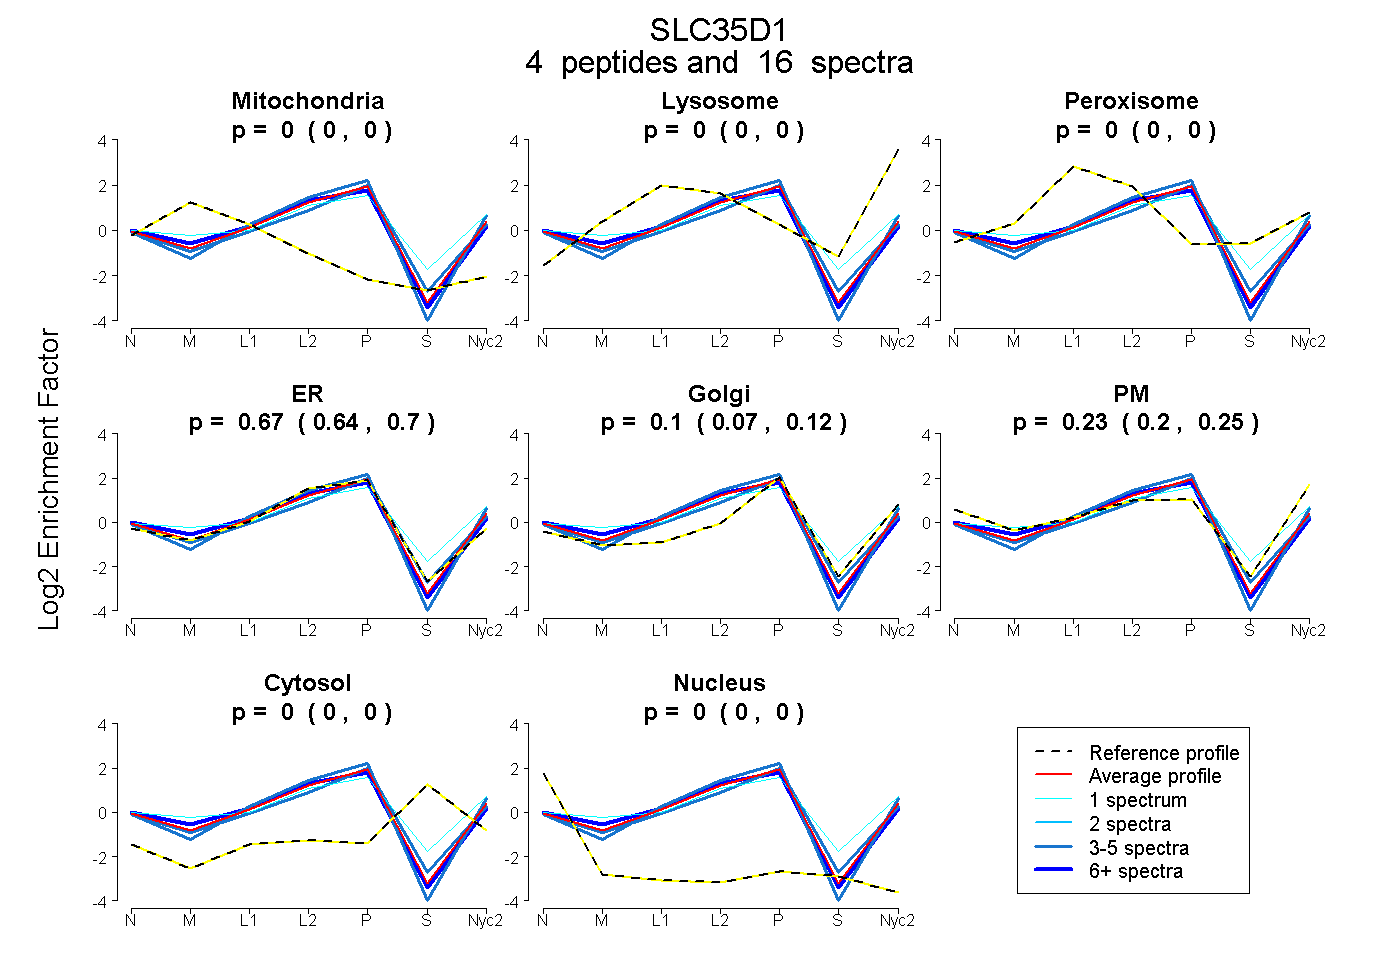
| Plot | Mito | Lyso | Perox | ER | Golgi | PM | Cytosol | Nucleus | |||||
| Expt A |
4 peptides |
16 spectra |
|
0.000 0.000 | 0.000 |
0.000 0.000 | 0.000 |
0.000 0.000 | 0.000 |
0.674 0.642 | 0.702 |
0.099 0.067 | 0.123 |
0.227 0.200 | 0.250 |
0.000 0.000 | 0.000 |
0.000 0.000 | 0.000 |
| 6 spectra, FPDFDR | 0.009 | 0.000 | 0.000 | 0.765 | 0.000 | 0.226 | 0.000 | 0.000 | ||
| 4 spectra, SVLTNYR | 0.000 | 0.000 | 0.000 | 0.586 | 0.295 | 0.119 | 0.000 | 0.000 | ||
| 5 spectra, LNLPMFTVLR | 0.000 | 0.000 | 0.000 | 0.747 | 0.044 | 0.209 | 0.000 | 0.000 | ||
| 1 spectrum, TFSWGIK | 0.000 | 0.000 | 0.169 | 0.265 | 0.327 | 0.236 | 0.002 | 0.000 |
| Plot | Mito | Lyso or Perox | ER | Golgi | PM | Cytosol | Nucleus | ||||||
| Expt B |
3 peptides |
6 spectra |
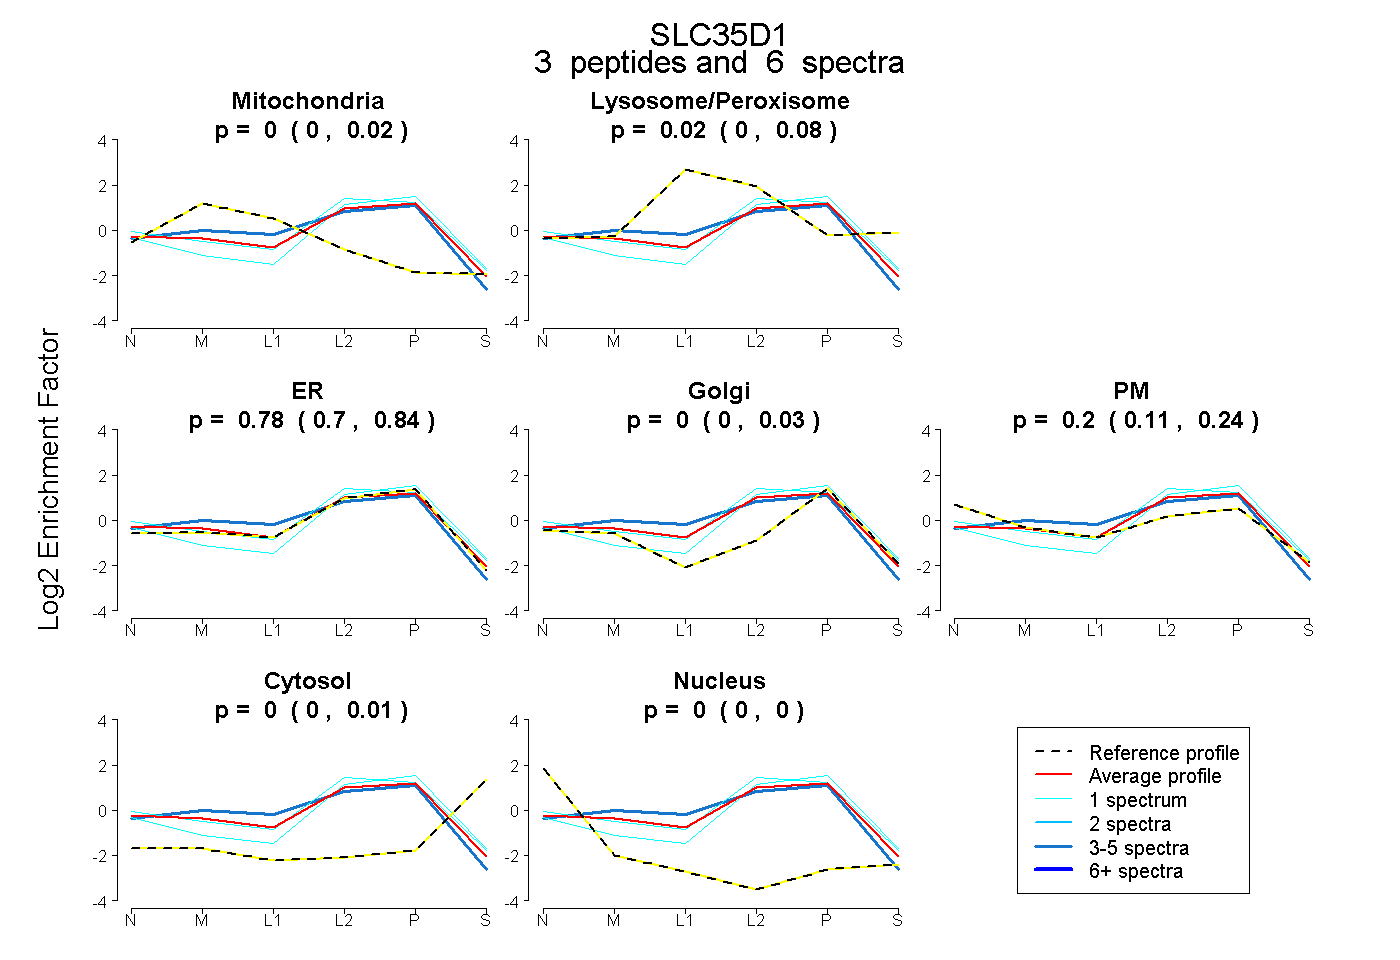 |
0.000 0.000 | 0.021 |
0.020 0.000 | 0.079 |
0.784 0.701 | 0.844 |
0.000 0.000 | 0.026 |
0.196 0.115 | 0.244 |
0.000 0.000 | 0.013 |
0.000 0.000 | 0.000 |
|||
| Plot | Lyso | Other | |||||||||||
| Expt C |
3 peptides |
14 spectra |
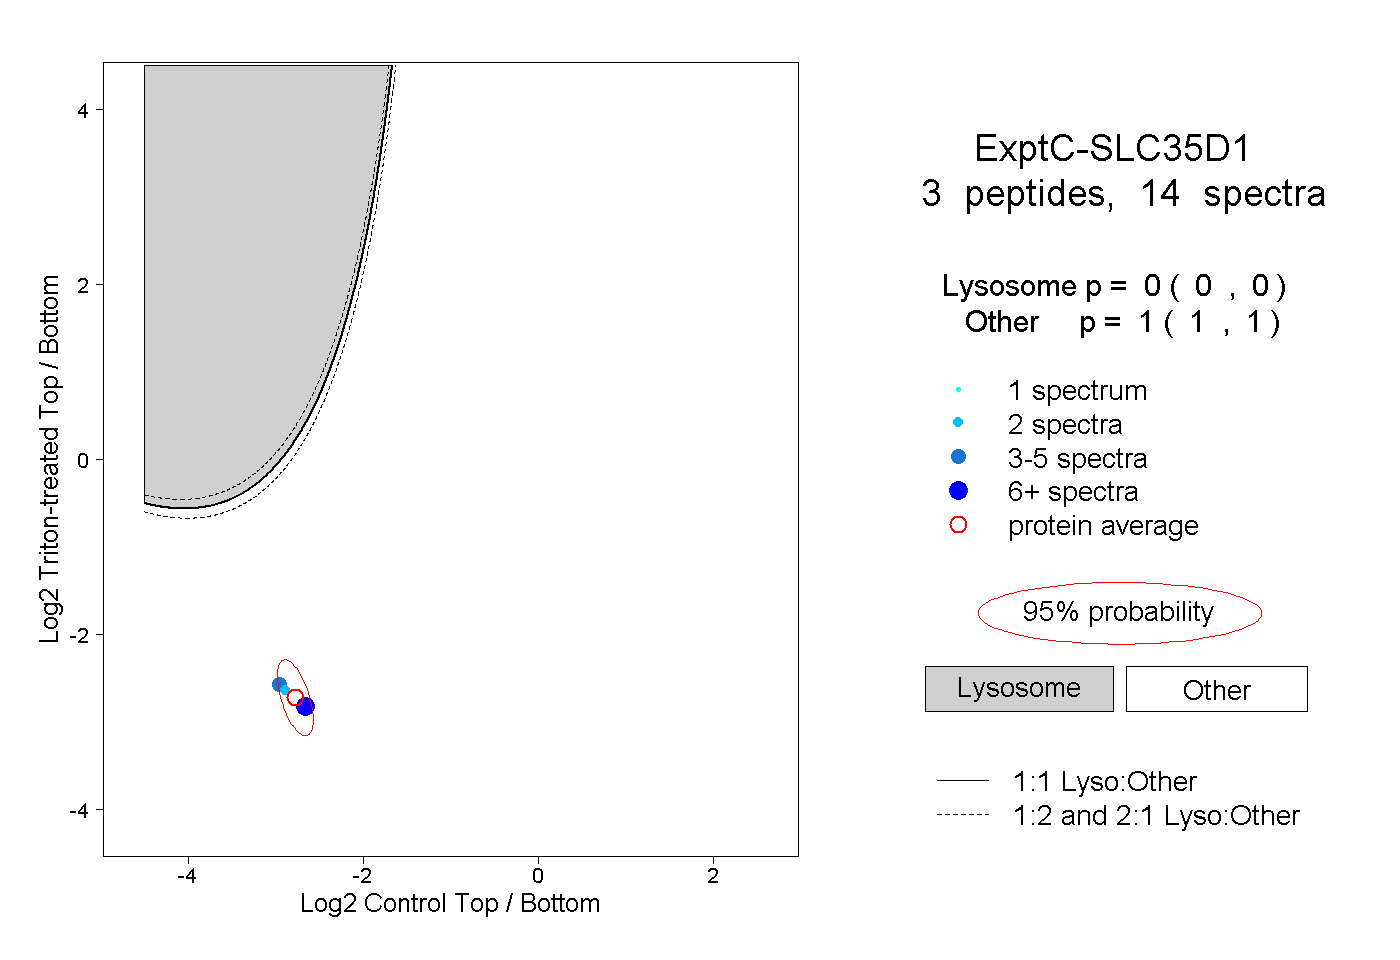 |
0.000 0.000 | 0.000 |
1.000 1.000 | 1.000 |
||||||||
| Plot | Lyso | Other | |||||||||||
| Expt D |
2 peptides |
5 spectra |
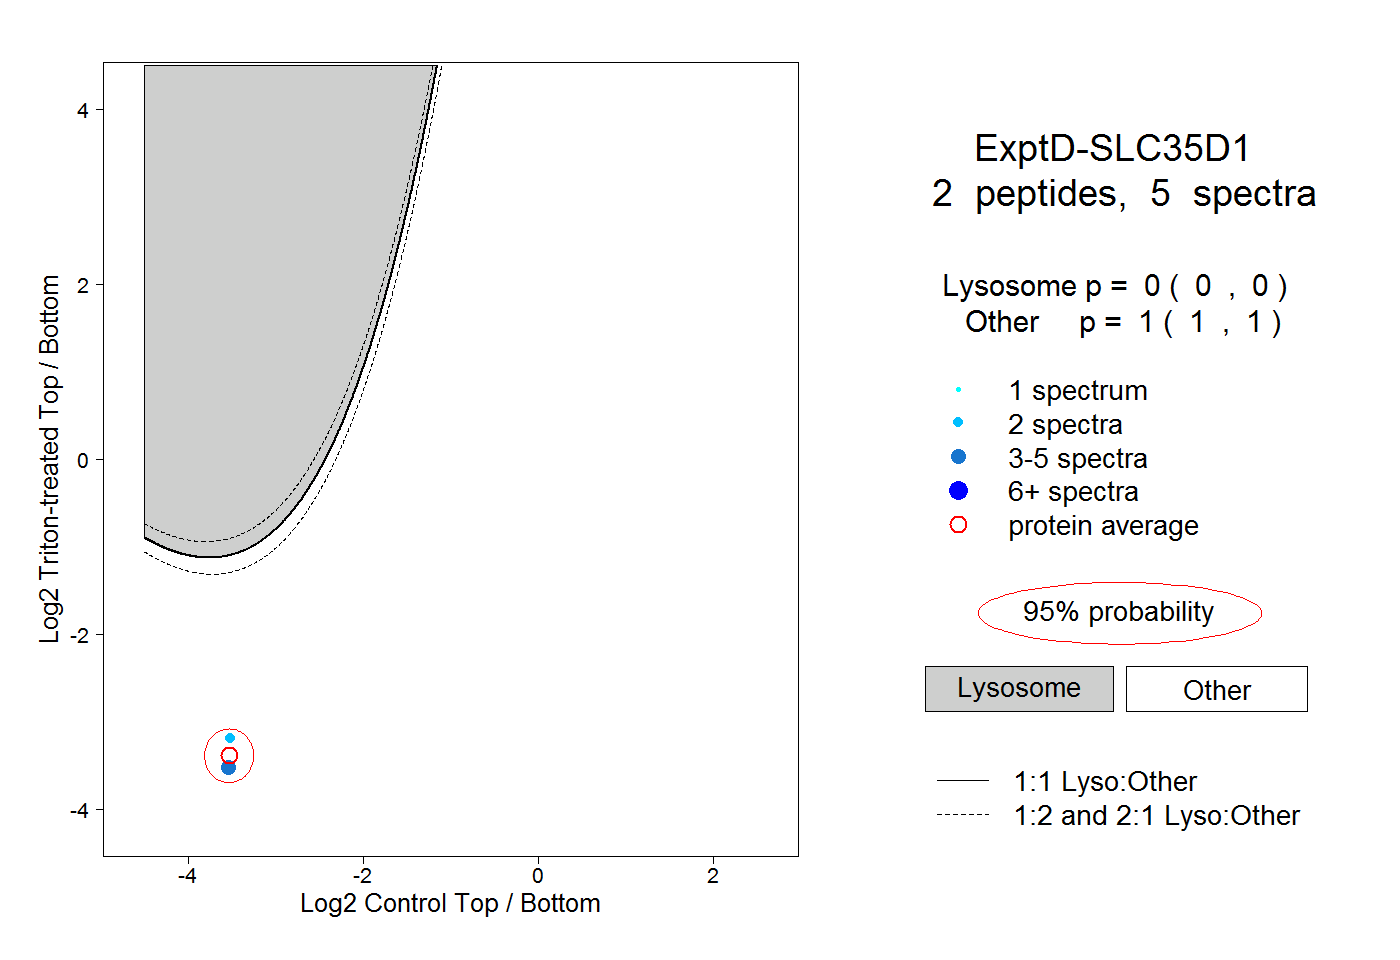 |
0.000 0.000 | 0.000 |
1.000 1.000 | 1.000 |