 13
13peptides
spectra
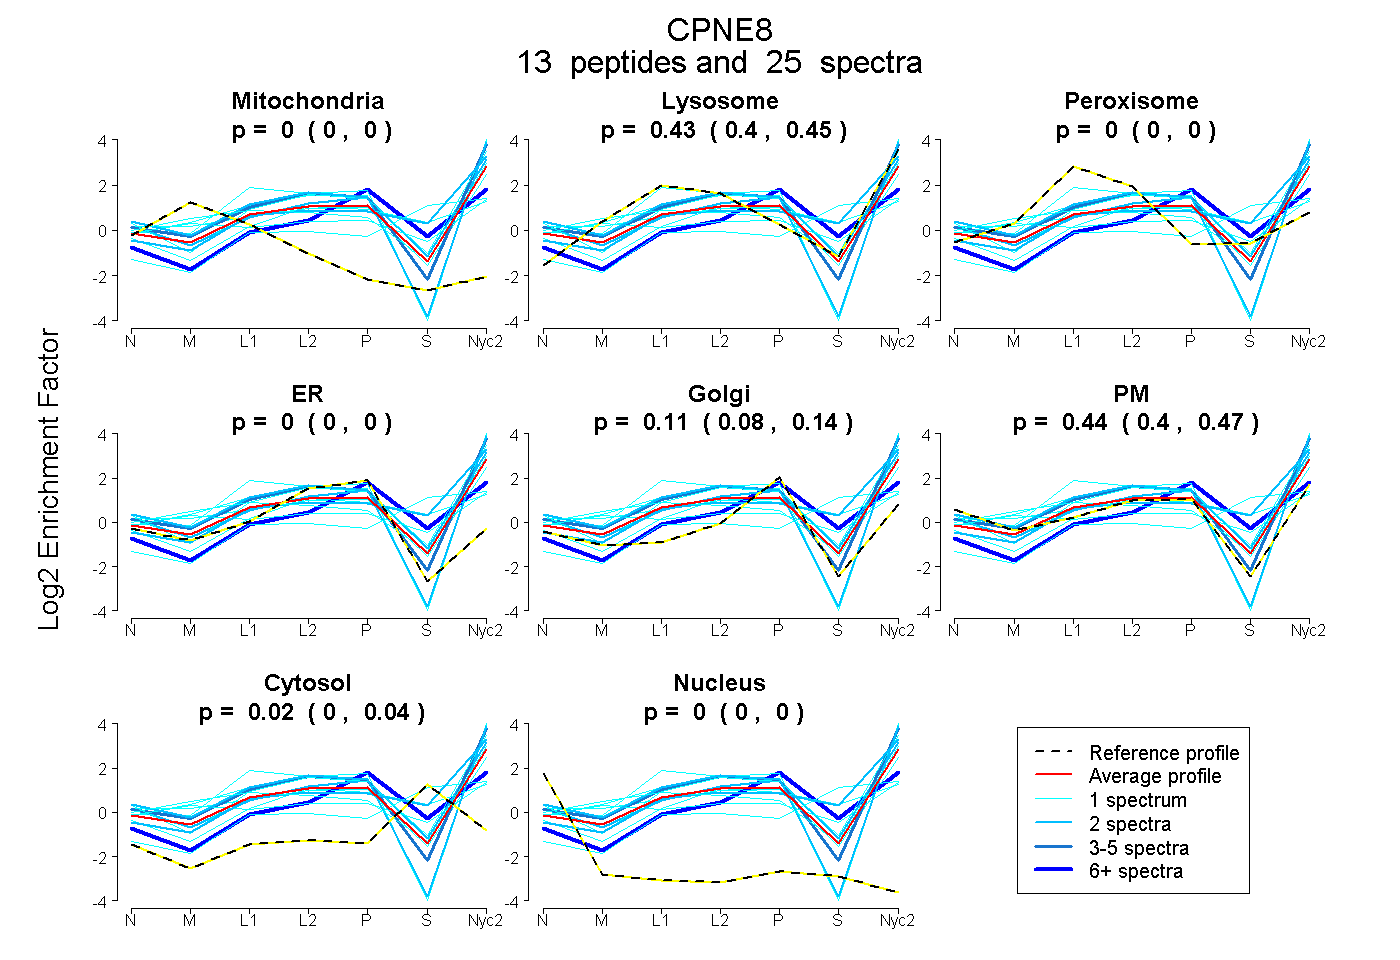
0.000 | 0.000
0.403 | 0.446
0.000 | 0.000
0.000 | 0.000
0.075 | 0.143
0.404 | 0.472
0.000 | 0.041
0.000 | 0.000
3peptides
spectra
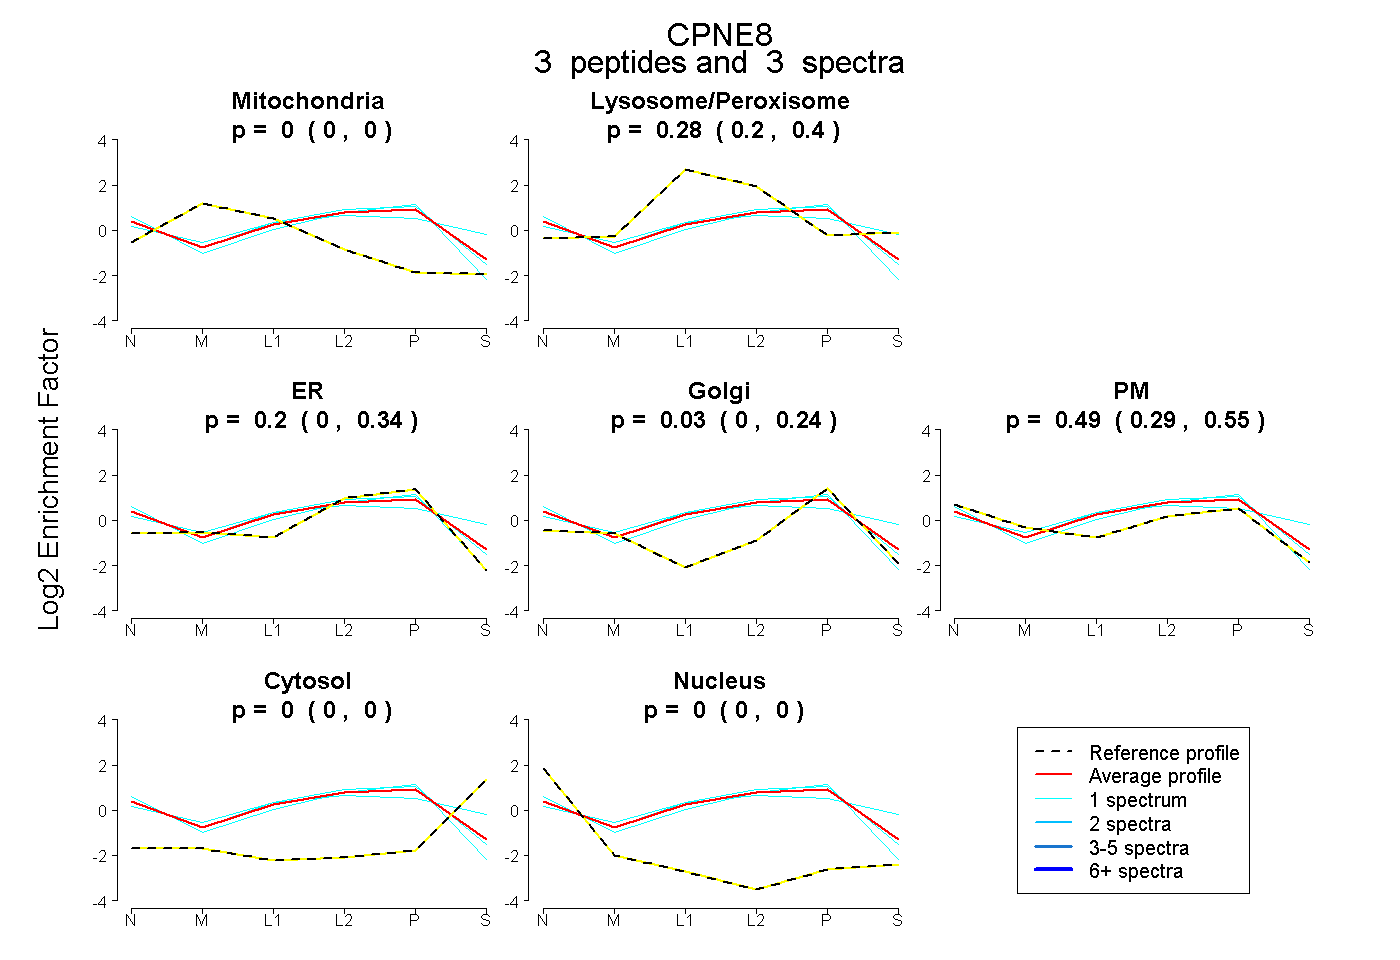
0.000 | 0.000
0.199 | 0.405
0.000 | 0.338
0.000 | 0.235
0.292 | 0.554
0.000 | 0.000
0.000 | 0.004
14peptides
spectra
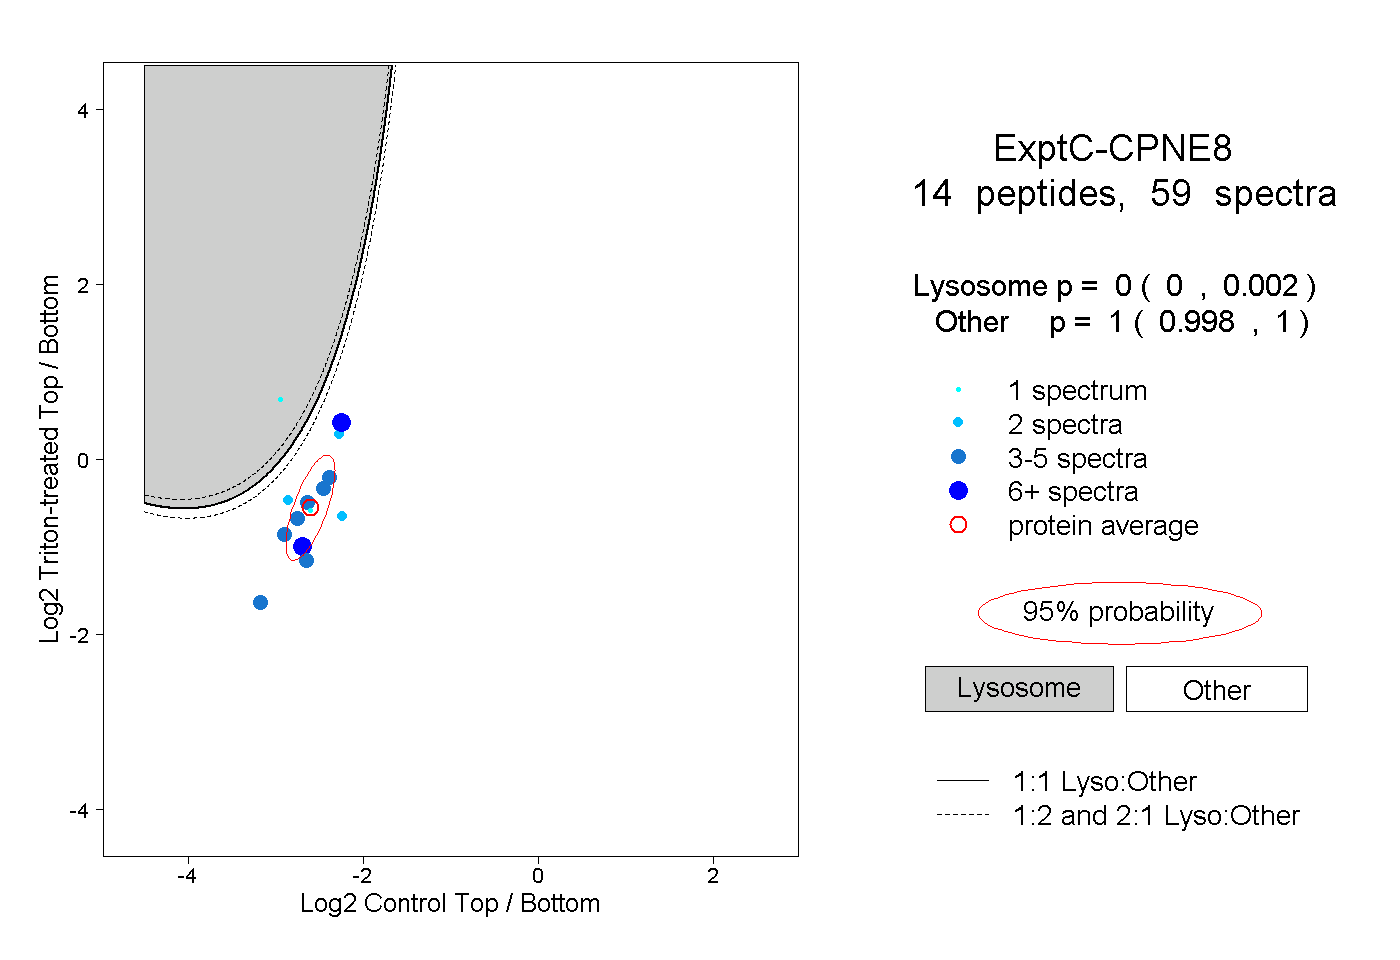
0.000 | 0.002
0.998 | 1.000