 13
13peptides
spectra
0.000 | 0.000
0.403 | 0.446
0.000 | 0.000
0.000 | 0.000
0.075 | 0.143
0.404 | 0.472
0.000 | 0.041
0.000 | 0.000
| Plot | Mito | Lyso | Perox | ER | Golgi | PM | Cytosol | Nucleus | |||||
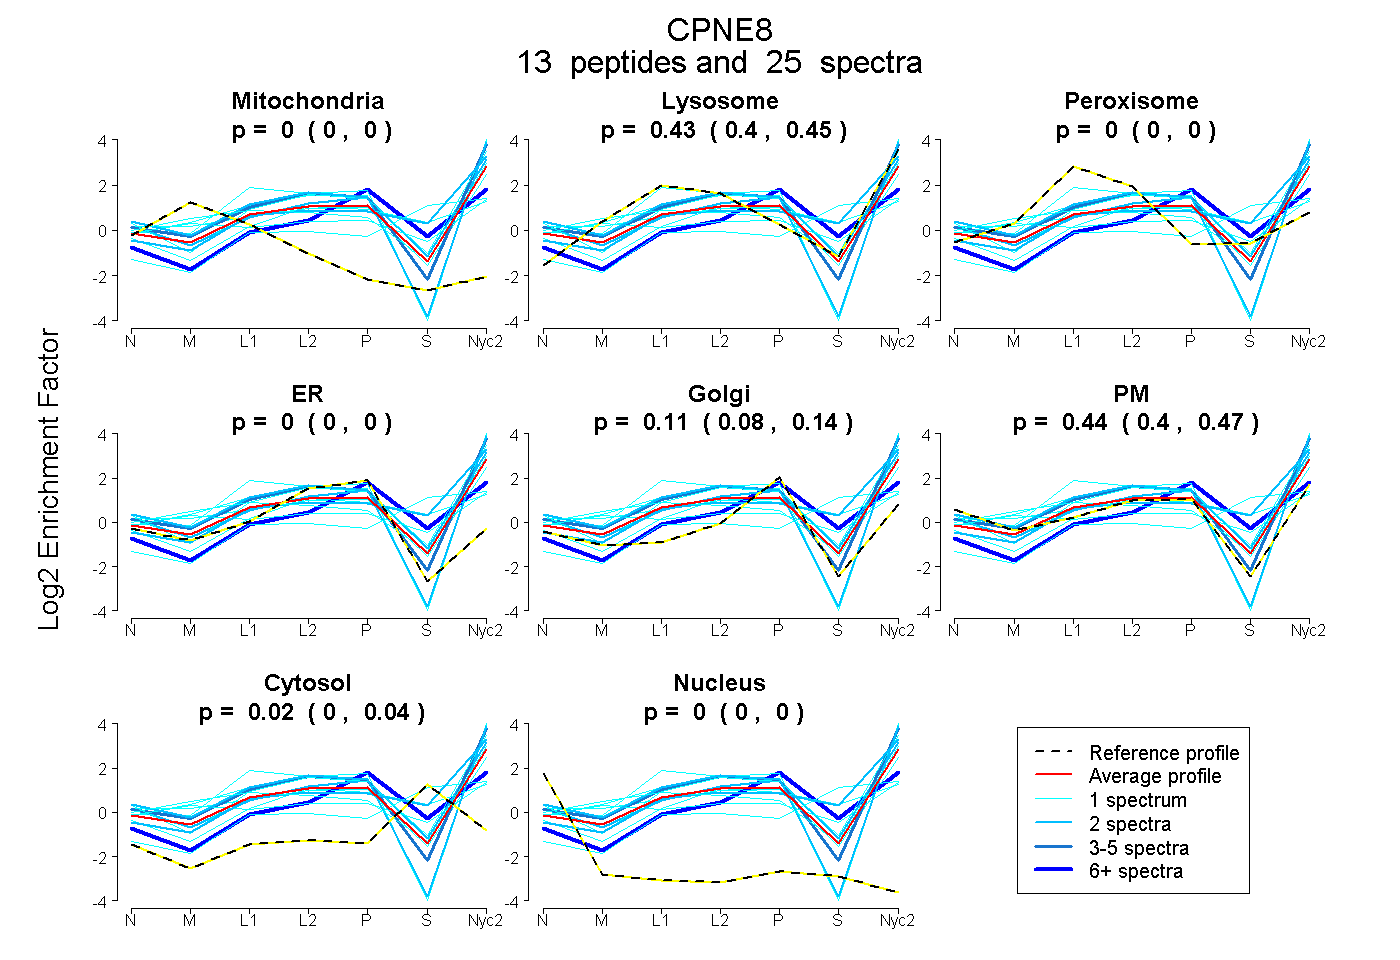
| Expt A |
13 peptides |
25 spectra |
|
0.000 0.000 | 0.000 |
0.427 0.403 | 0.446 |
0.000 0.000 | 0.000 |
0.000 0.000 | 0.000 |
0.112 0.075 | 0.143 |
0.440 0.404 | 0.472 |
0.021 0.000 | 0.041 |
0.000 0.000 | 0.000 |
| 1 spectrum, DVLAEIPEQFLSYMR | 0.000 | 0.462 | 0.000 | 0.000 | 0.000 | 0.538 | 0.000 | 0.000 | ||
| 2 spectra, SDPFLVFYR | 0.000 | 0.318 | 0.000 | 0.000 | 0.000 | 0.682 | 0.000 | 0.000 | ||
| 2 spectra, VEVYDWDR | 0.000 | 0.637 | 0.000 | 0.000 | 0.000 | 0.143 | 0.220 | 0.000 | ||
| 2 spectra, FILDYFFEER | 0.000 | 0.401 | 0.000 | 0.000 | 0.094 | 0.505 | 0.000 | 0.000 | ||
| 1 spectrum, YASSVK | 0.006 | 0.500 | 0.000 | 0.000 | 0.000 | 0.481 | 0.012 | 0.000 | ||
| 1 spectrum, GQSQFNVYEVVNPK | 0.000 | 0.390 | 0.000 | 0.000 | 0.000 | 0.000 | 0.610 | 0.000 | ||
| 1 spectrum, LPPDGR | 0.000 | 0.464 | 0.000 | 0.000 | 0.000 | 0.536 | 0.000 | 0.000 | ||
| 1 spectrum, SVQLYGPTNFAPVINHVAR | 0.000 | 0.306 | 0.024 | 0.169 | 0.000 | 0.156 | 0.344 | 0.000 | ||
| 1 spectrum, AVGEIVQDYDSDK | 0.000 | 0.402 | 0.000 | 0.000 | 0.000 | 0.598 | 0.000 | 0.000 | ||
| 7 spectra, DIVQFVPFR | 0.000 | 0.300 | 0.000 | 0.000 | 0.492 | 0.000 | 0.208 | 0.000 | ||
| 1 spectrum, DGSHDFIGEFTTSYR | 0.000 | 0.321 | 0.000 | 0.000 | 0.000 | 0.669 | 0.010 | 0.000 | ||
| 1 spectrum, NTLNPVWQAFK | 0.059 | 0.254 | 0.047 | 0.000 | 0.000 | 0.414 | 0.225 | 0.000 | ||
| 4 spectra, LEKPIVGIPGR | 0.000 | 0.473 | 0.000 | 0.000 | 0.000 | 0.527 | 0.000 | 0.000 |
| Plot | Mito | Lyso or Perox | ER | Golgi | PM | Cytosol | Nucleus | ||||||
| Expt B |
3 peptides |
3 spectra |
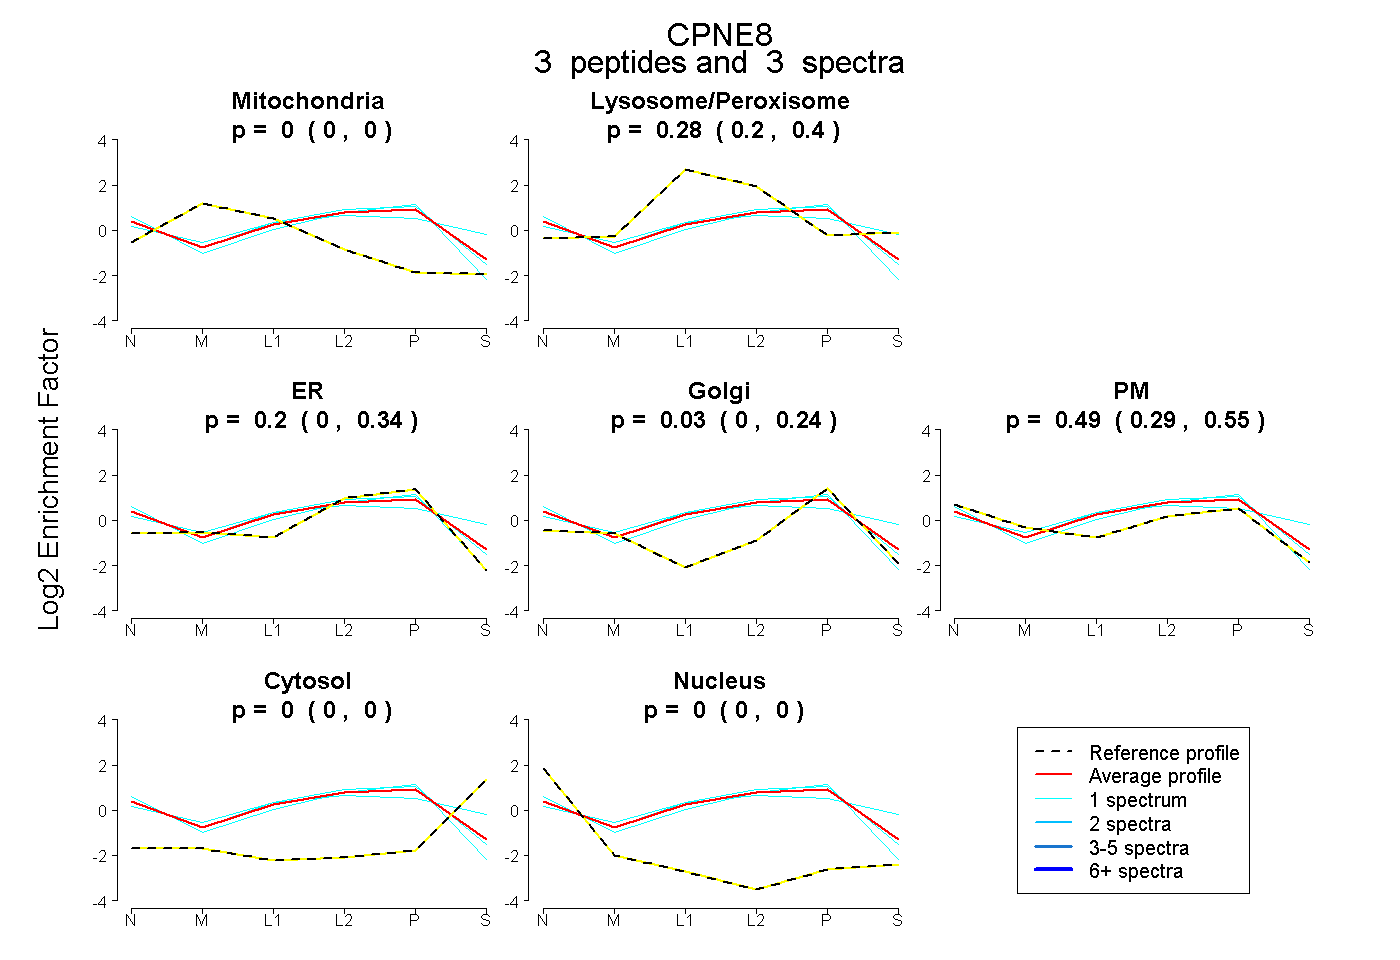 |
0.000 0.000 | 0.000 |
0.282 0.199 | 0.405 |
0.199 0.000 | 0.338 |
0.035 0.000 | 0.235 |
0.485 0.292 | 0.554 |
0.000 0.000 | 0.000 |
0.000 0.000 | 0.004 |
|||
| Plot | Lyso | Other | |||||||||||
| Expt C |
14 peptides |
59 spectra |
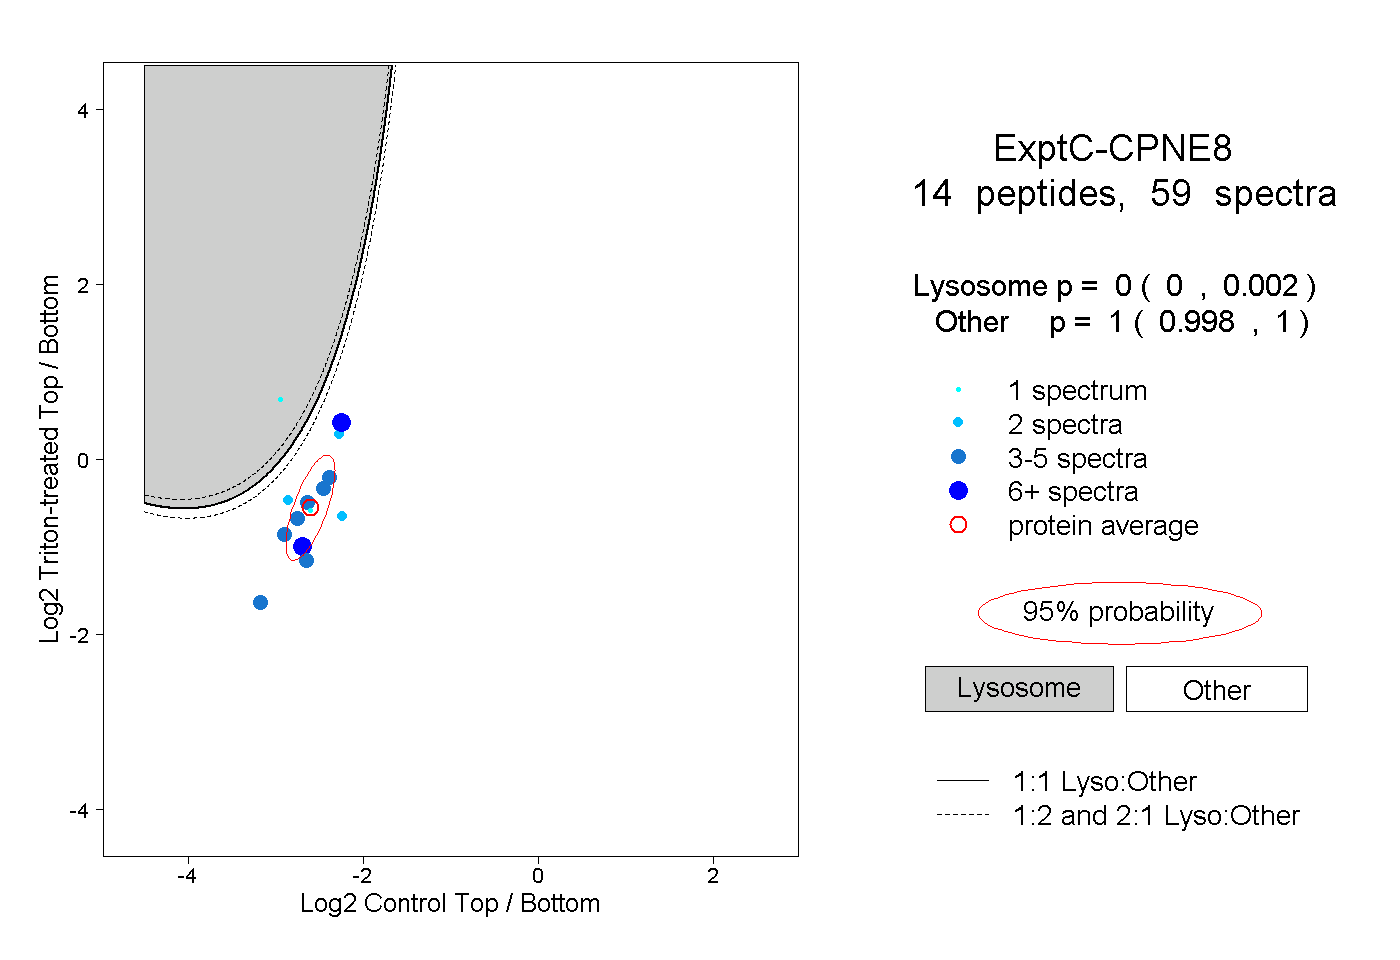 |
0.000 0.000 | 0.002 |
1.000 0.998 | 1.000 |