 17
17peptides
spectra
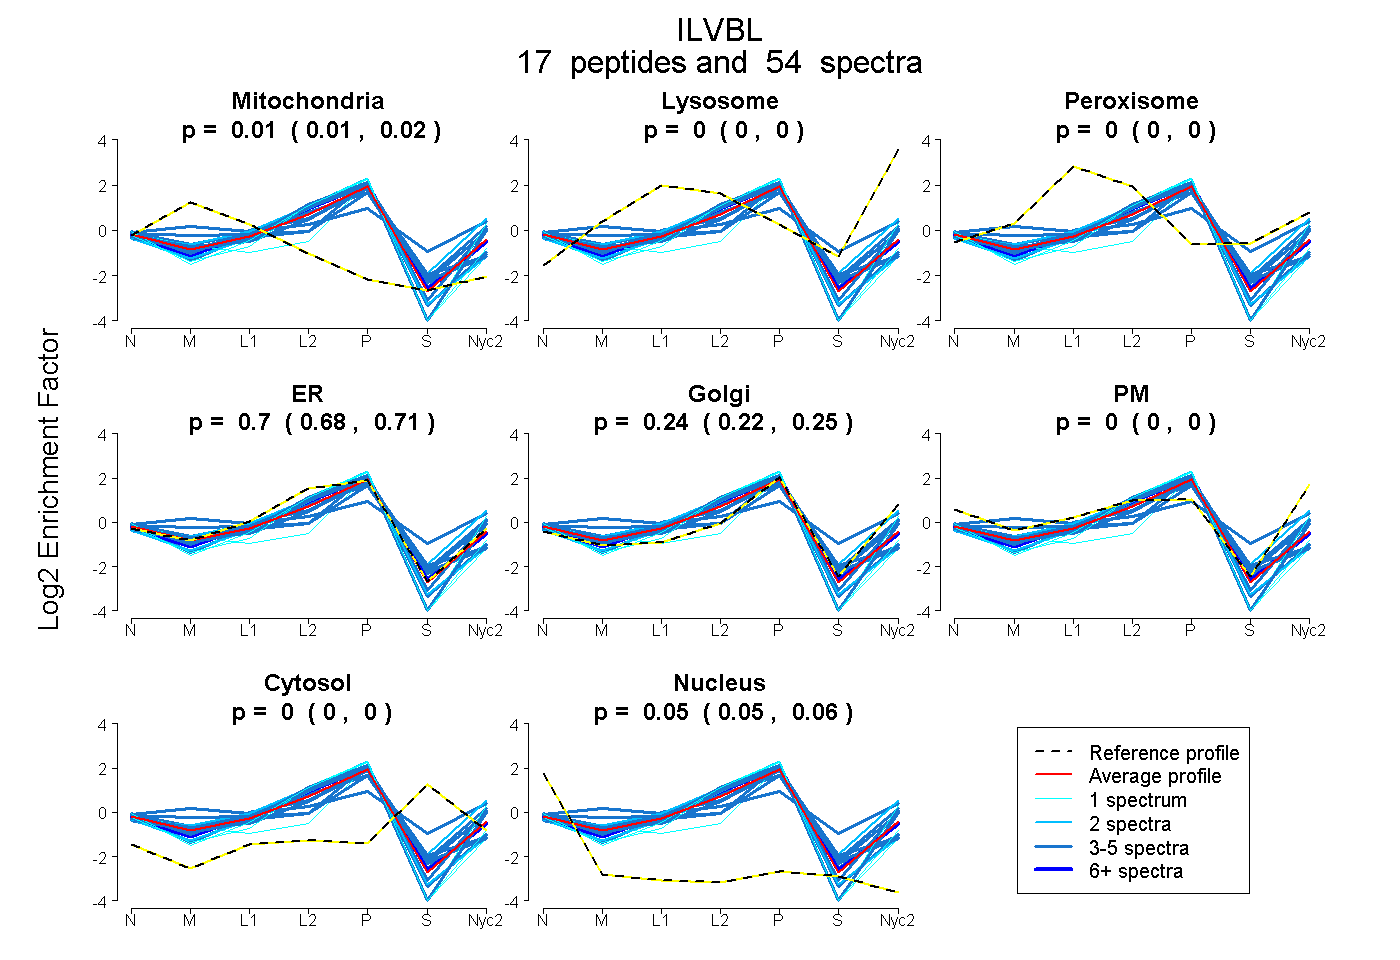
0.006 | 0.017
0.000 | 0.000
0.000 | 0.000
0.682 | 0.715
0.219 | 0.249
0.000 | 0.000
0.000 | 0.000
0.047 | 0.056
11peptides
spectra
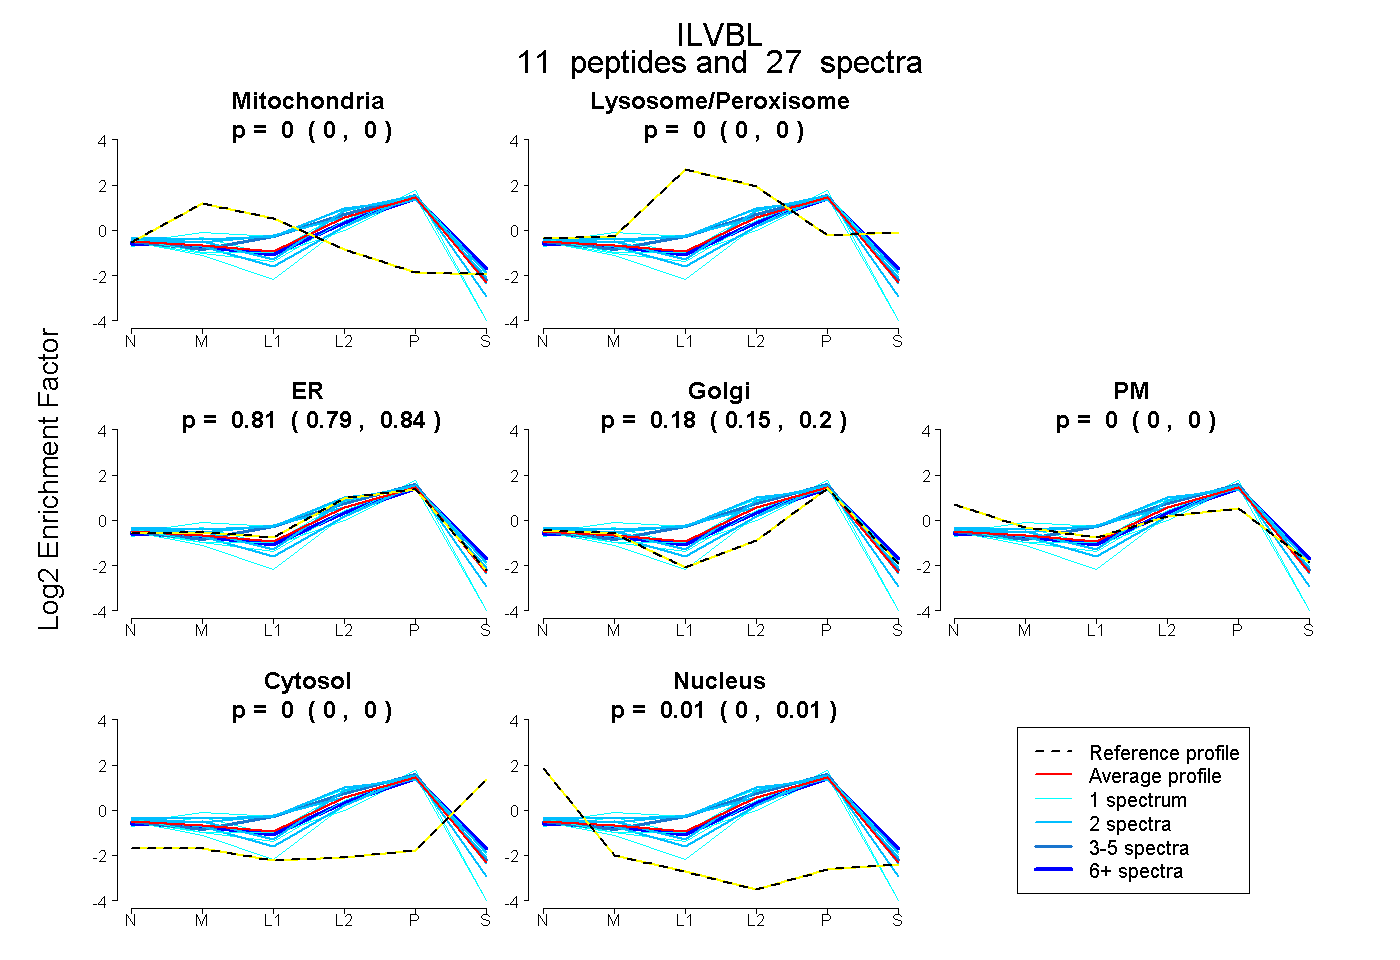
0.000 | 0.000
0.000 | 0.000
0.789 | 0.837
0.152 | 0.204
0.000 | 0.000
0.000 | 0.000
0.000 | 0.010
15peptides
spectra
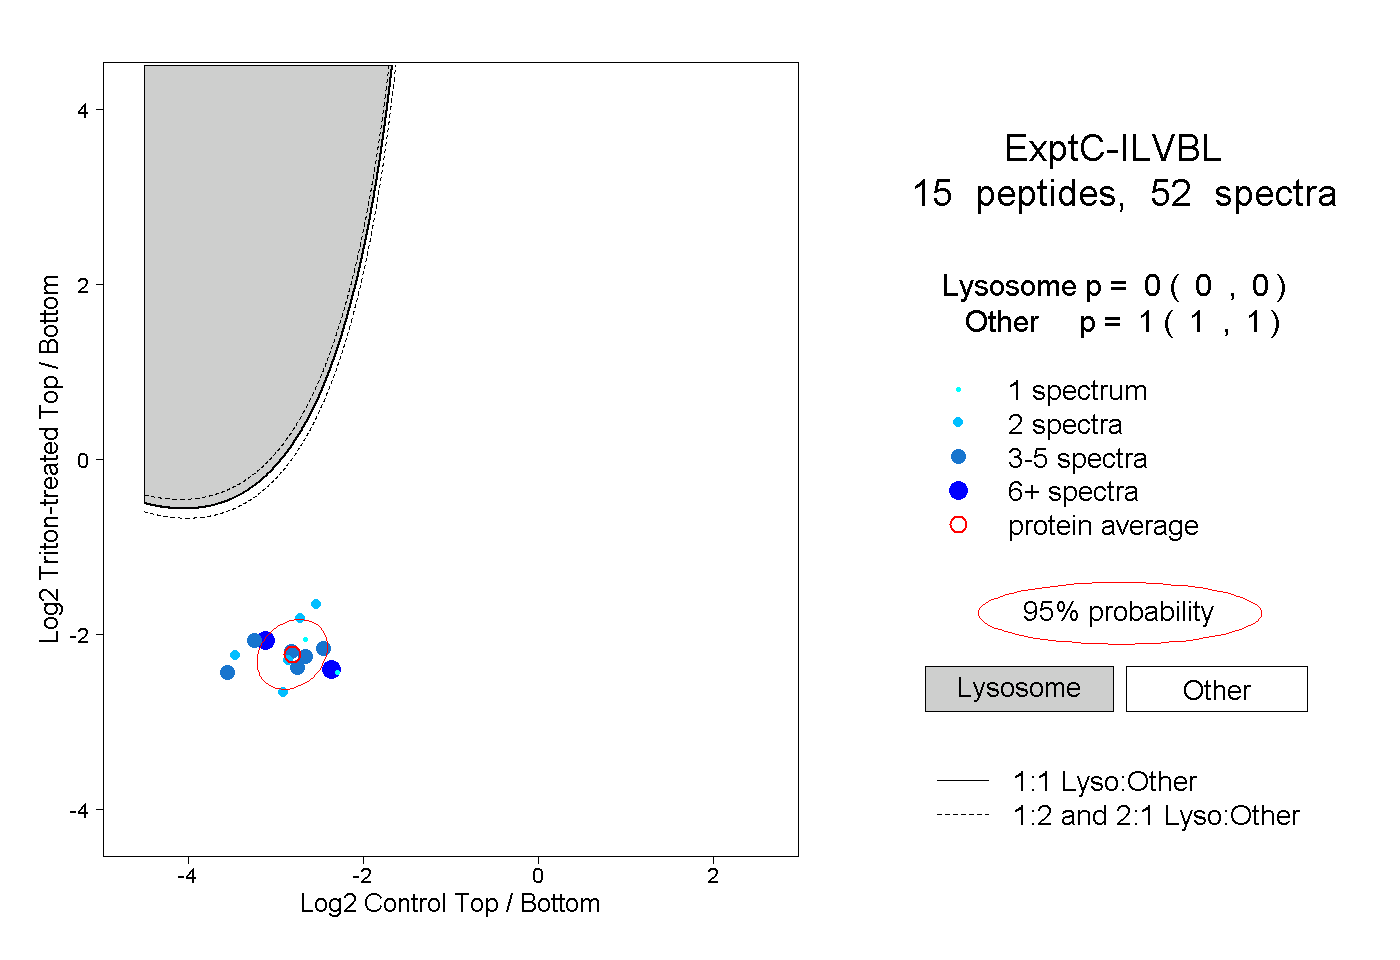
0.000 | 0.000
1.000 | 1.000
4peptides
spectra
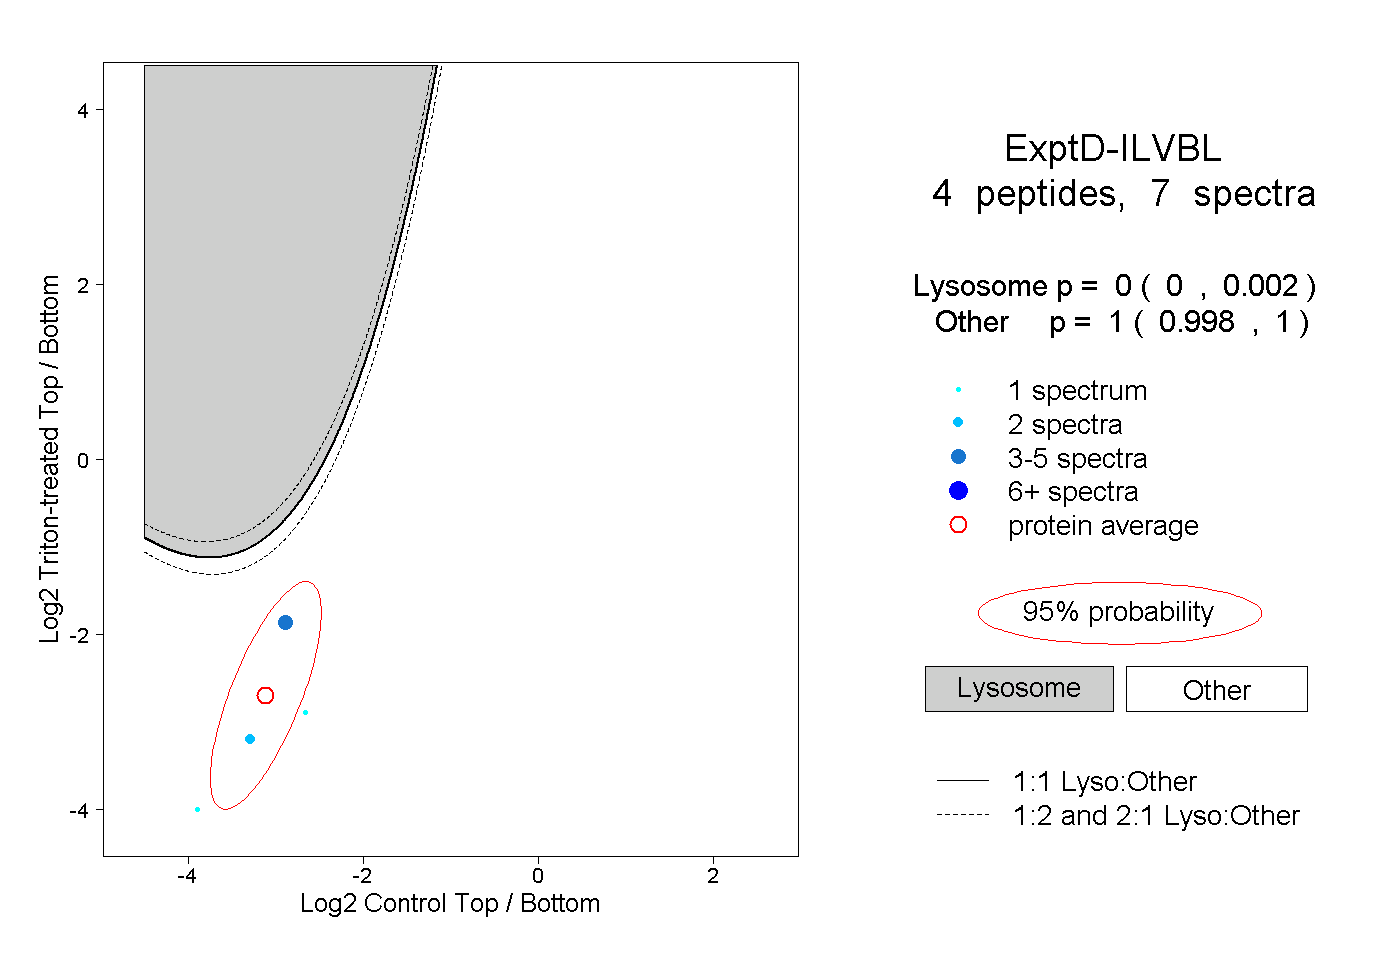
0.000 | 0.002
0.998 | 1.000