 7
7peptides
spectra
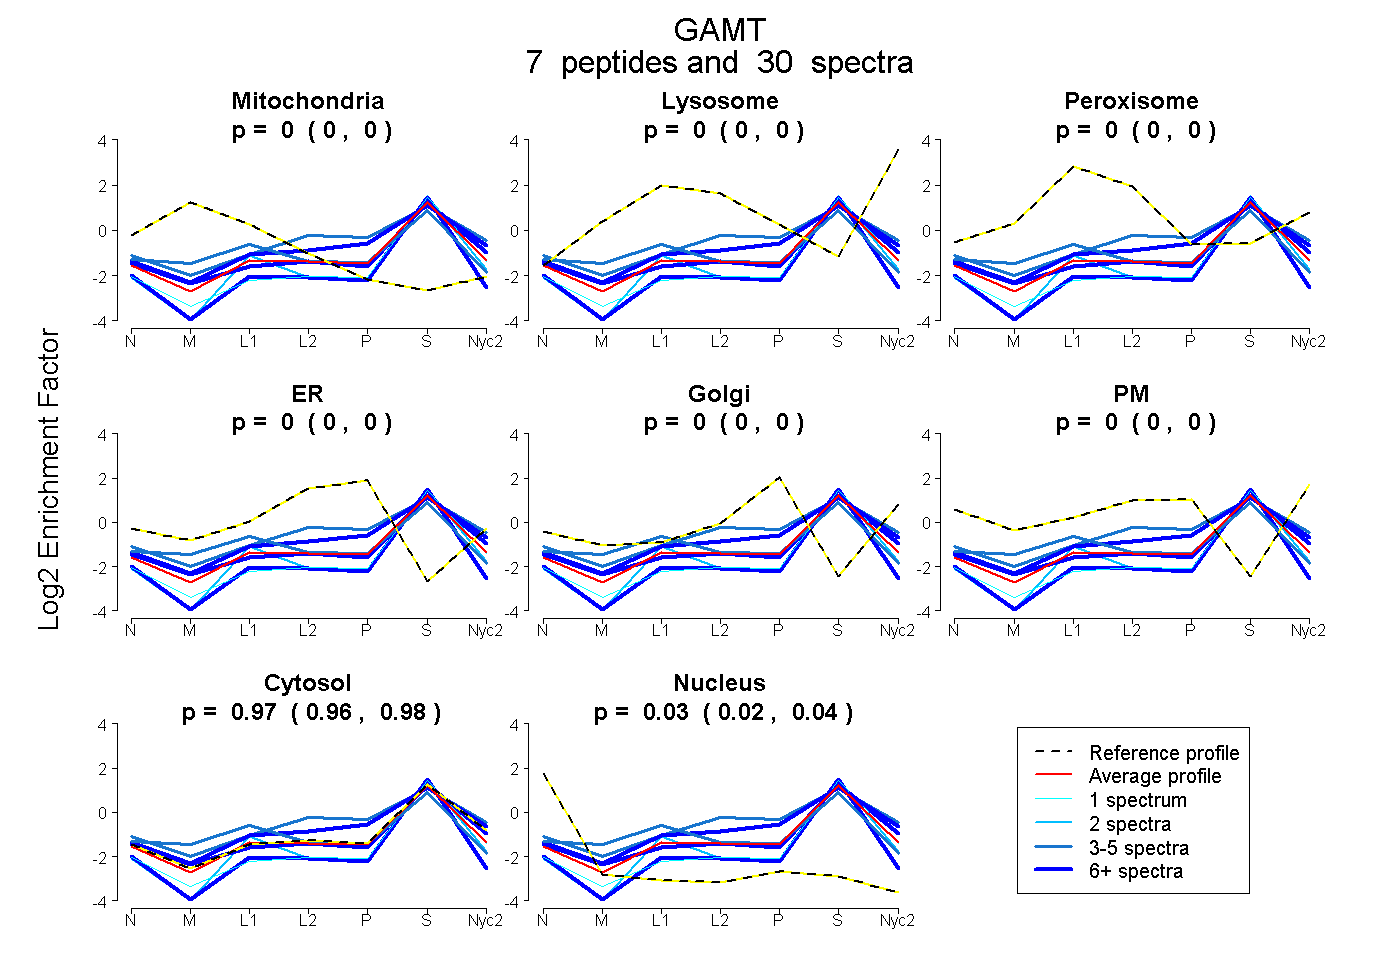
0.000 | 0.001
0.000 | 0.000
0.000 | 0.000
0.000 | 0.000
0.000 | 0.000
0.000 | 0.000
0.959 | 0.978
0.020 | 0.039
1peptide
spectra
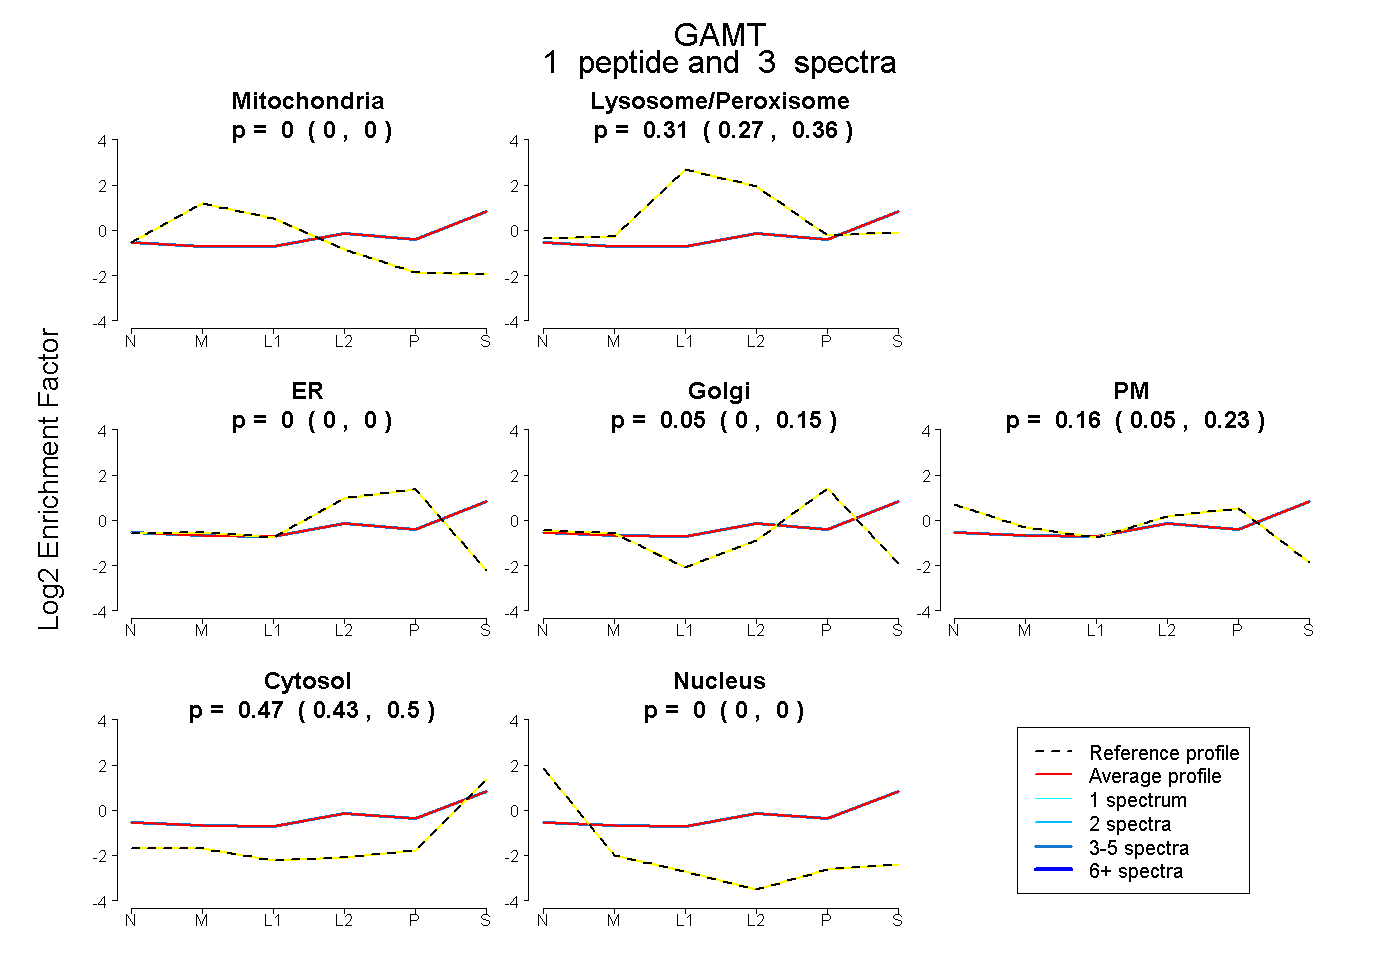
0.000 | 0.000
0.267 | 0.355
0.000 | 0.000
0.000 | 0.150
0.049 | 0.227
0.431 | 0.500
0.000 | 0.000
6peptides
spectra
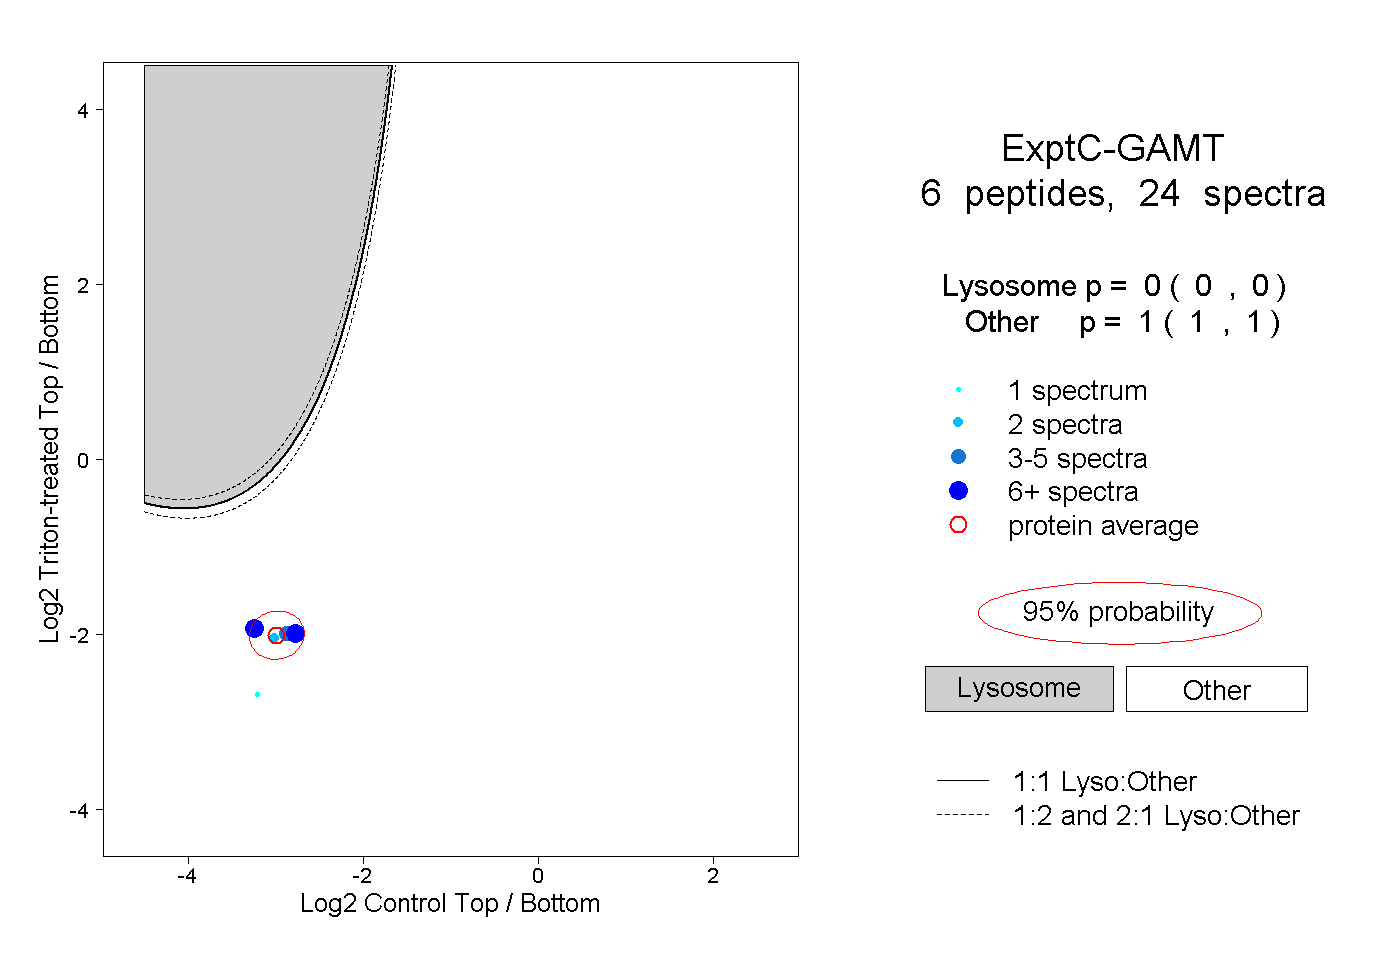
0.000 | 0.000
1.000 | 1.000