 7
7peptides
spectra
0.000 | 0.001
0.000 | 0.000
0.000 | 0.000
0.000 | 0.000
0.000 | 0.000
0.000 | 0.000
0.959 | 0.978
0.020 | 0.039
| Plot | Mito | Lyso | Perox | ER | Golgi | PM | Cytosol | Nucleus | |||||
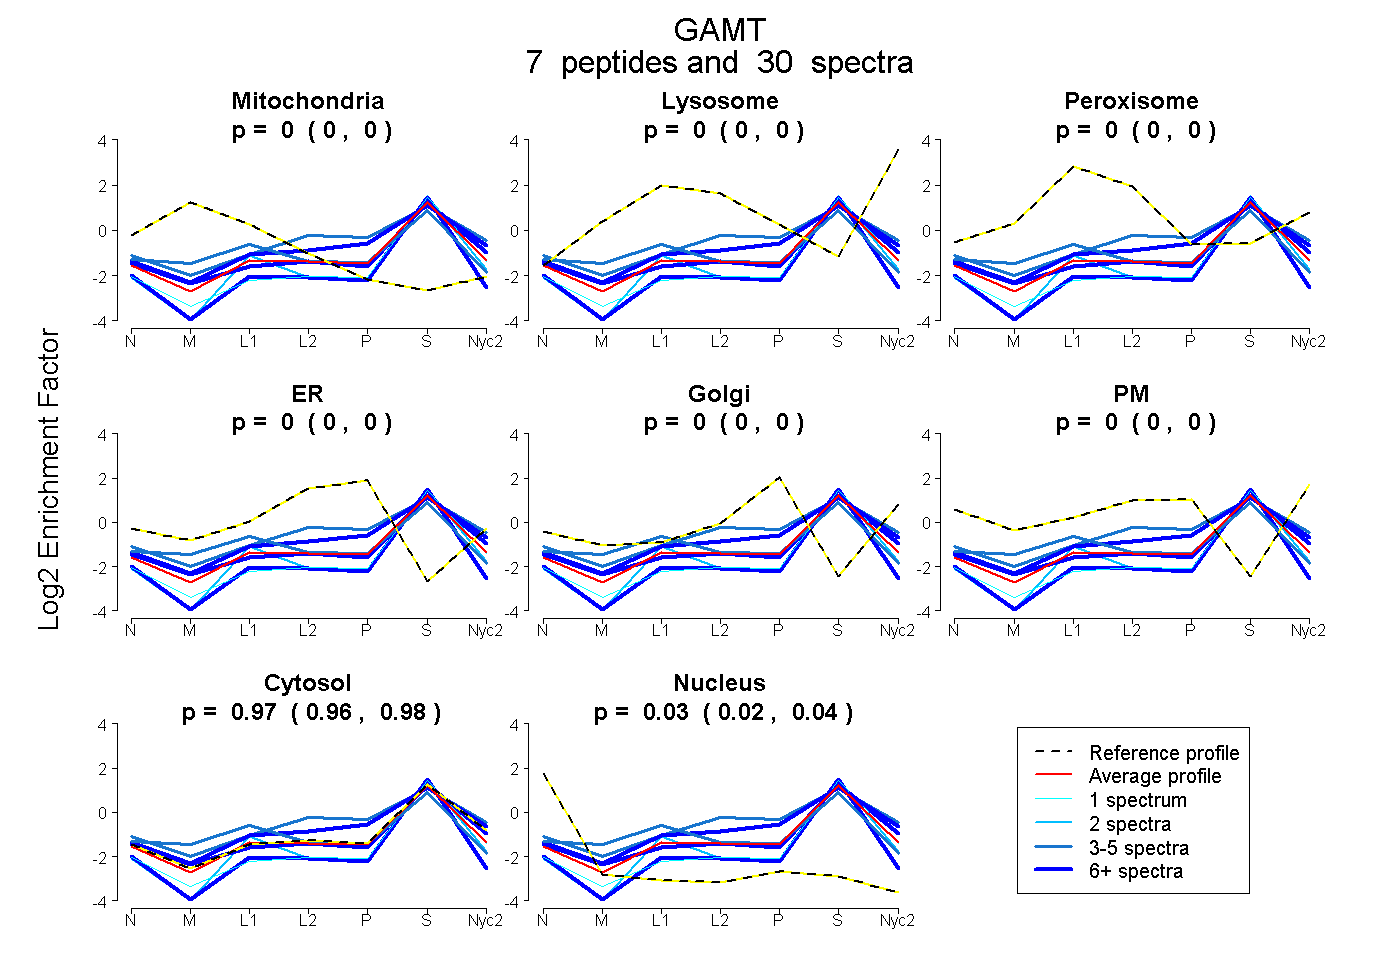
| Expt A |
7 peptides |
30 spectra |
|
0.000 0.000 | 0.001 |
0.000 0.000 | 0.000 |
0.000 0.000 | 0.000 |
0.000 0.000 | 0.000 |
0.000 0.000 | 0.000 |
0.000 0.000 | 0.000 |
0.970 0.959 | 0.978 |
0.030 0.020 | 0.039 |
| 7 spectra, WETPYMHSLAAAAASR | 0.000 | 0.031 | 0.000 | 0.105 | 0.003 | 0.000 | 0.860 | 0.000 | ||
| 1 spectrum, VLEVGFGMAIAASR | 0.000 | 0.000 | 0.000 | 0.000 | 0.000 | 0.000 | 0.939 | 0.061 | ||
| 6 spectra, ENICTEVMALVPPADCR | 0.000 | 0.000 | 0.000 | 0.000 | 0.000 | 0.000 | 0.863 | 0.137 | ||
| 4 spectra, EHWIIECNDGVFQR | 0.000 | 0.048 | 0.033 | 0.161 | 0.000 | 0.000 | 0.759 | 0.000 | ||
| 2 spectra, AAPAAYDTSDTHLQILGKPVMER | 0.000 | 0.000 | 0.000 | 0.000 | 0.000 | 0.000 | 0.958 | 0.042 | ||
| 3 spectra, YYAFPQMITPLVTK | 0.232 | 0.000 | 0.000 | 0.000 | 0.000 | 0.000 | 0.768 | 0.000 | ||
| 7 spectra, LQNWALK | 0.013 | 0.000 | 0.000 | 0.000 | 0.000 | 0.000 | 0.970 | 0.016 |
| Plot | Mito | Lyso or Perox | ER | Golgi | PM | Cytosol | Nucleus | ||||||
| Expt B |
1 peptide |
3 spectra |
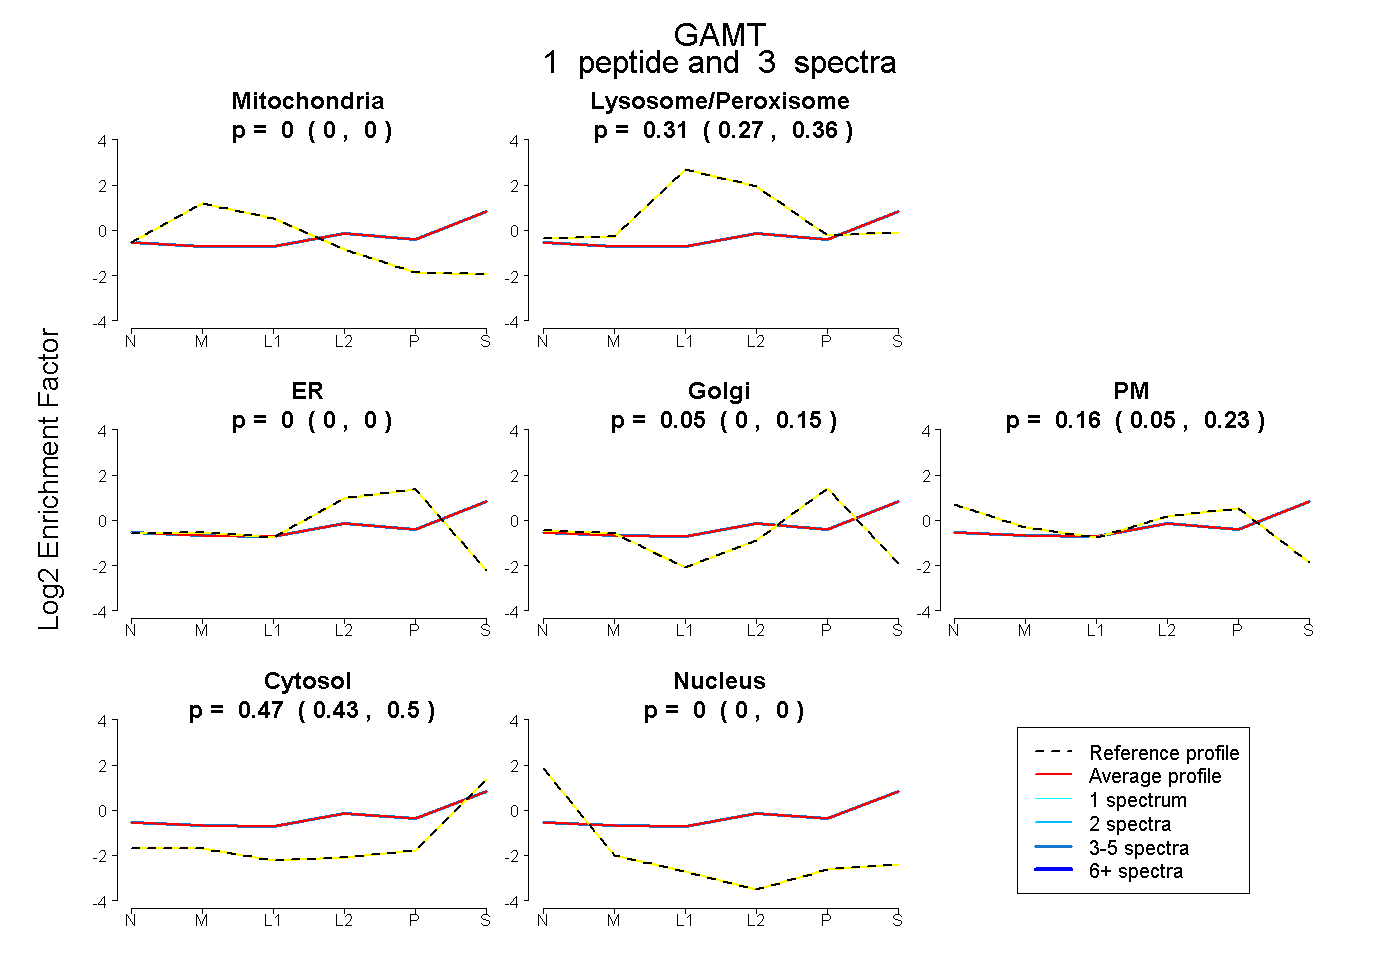 |
0.000 0.000 | 0.000 |
0.313 0.267 | 0.355 |
0.000 0.000 | 0.000 |
0.054 0.000 | 0.150 |
0.160 0.049 | 0.227 |
0.472 0.431 | 0.500 |
0.000 0.000 | 0.000 |
|||
| Plot | Lyso | Other | |||||||||||
| Expt C |
6 peptides |
24 spectra |
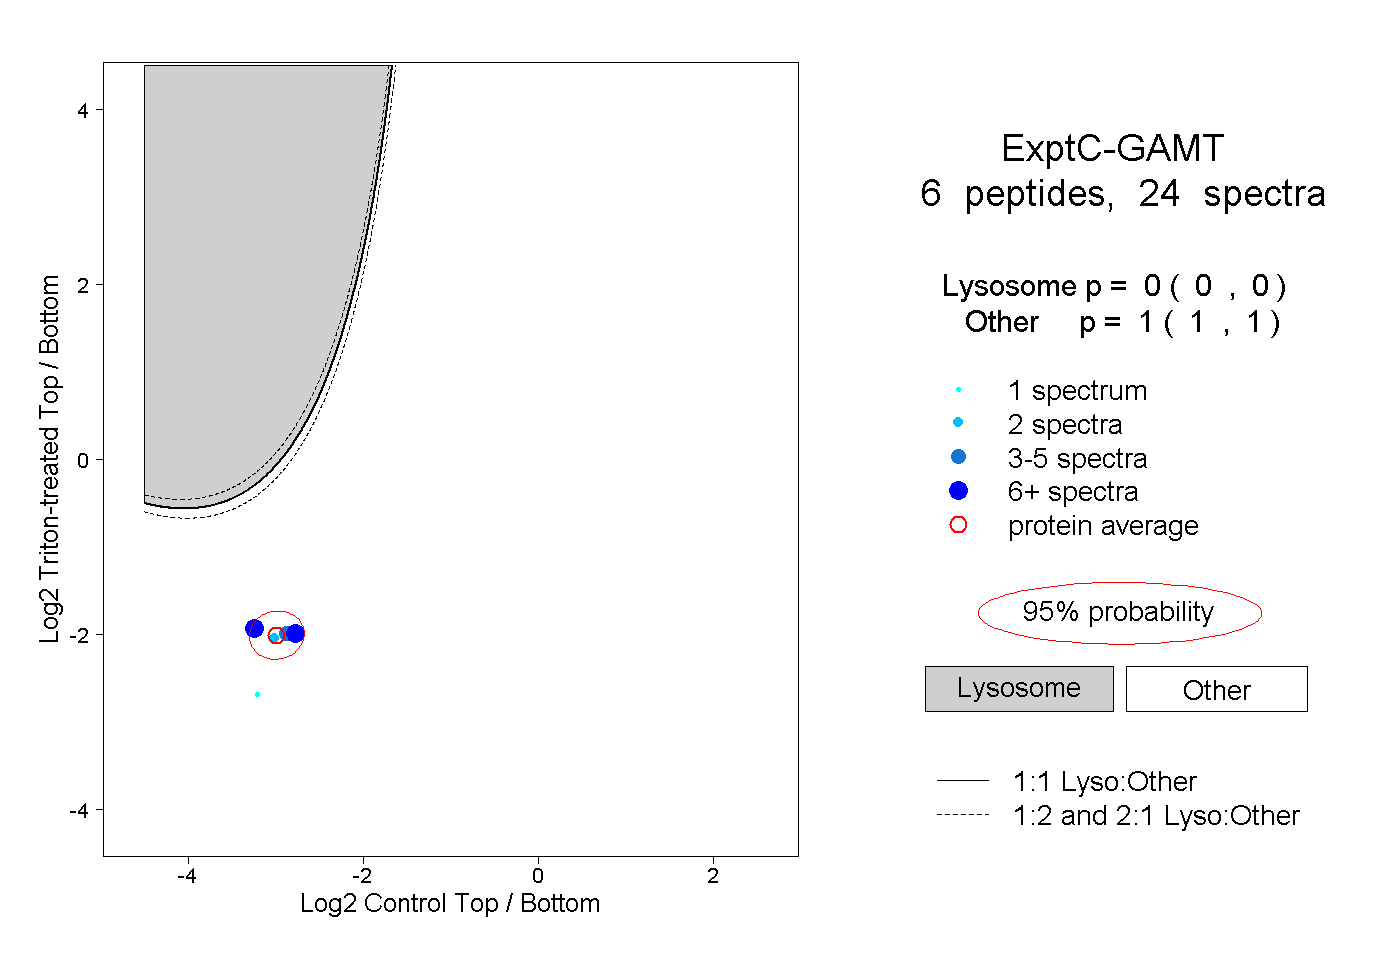 |
0.000 0.000 | 0.000 |
1.000 1.000 | 1.000 |