 7
7peptides
spectra
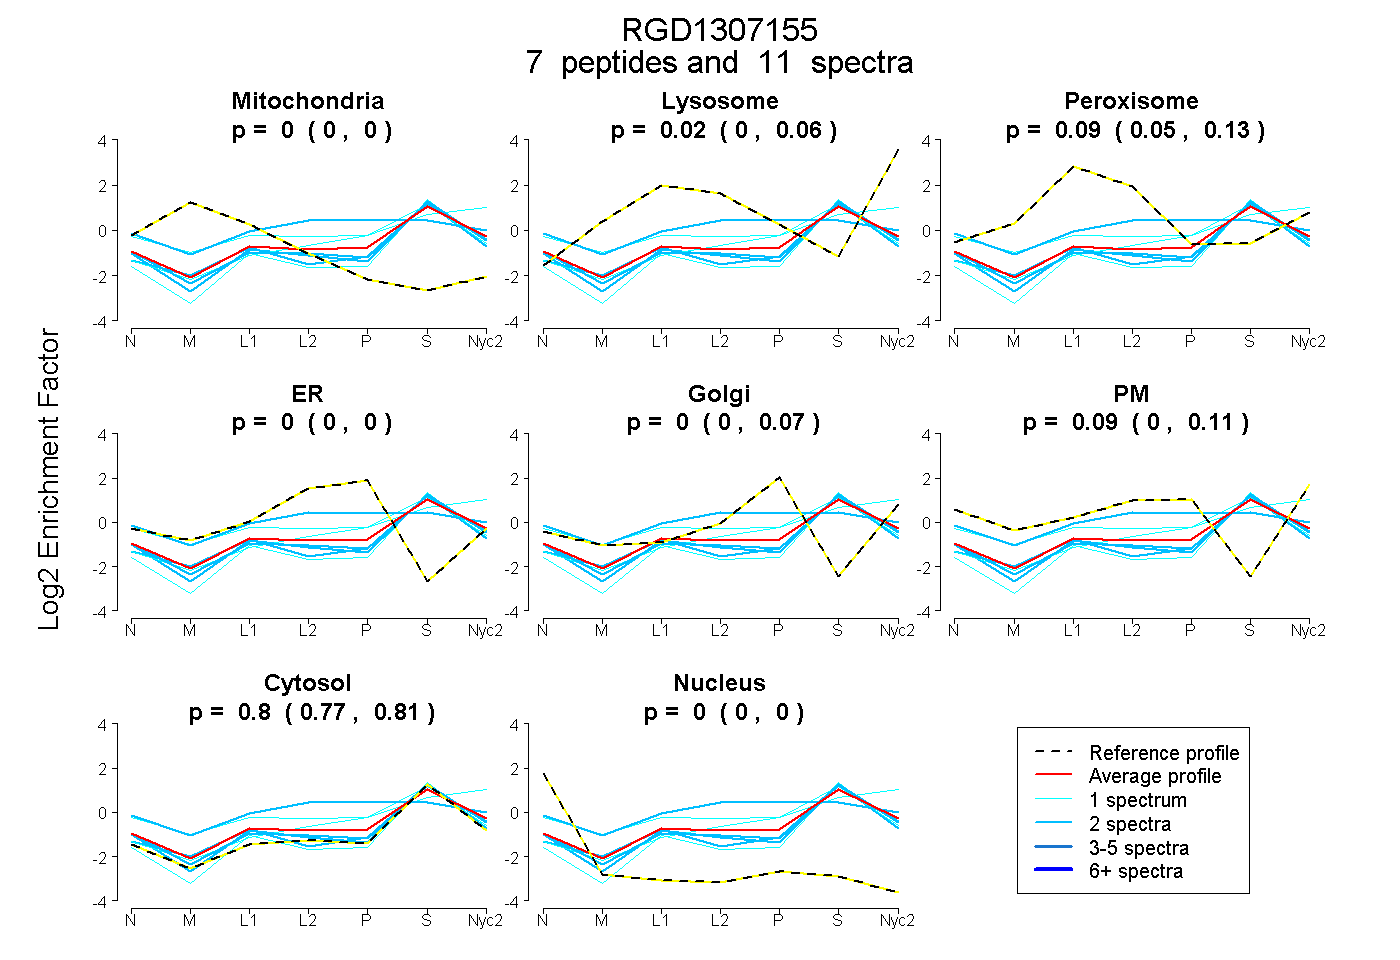
0.000 | 0.000
0.000 | 0.061
0.049 | 0.131
0.000 | 0.000
0.000 | 0.073
0.000 | 0.109
0.766 | 0.813
0.000 | 0.000
5peptides
spectra
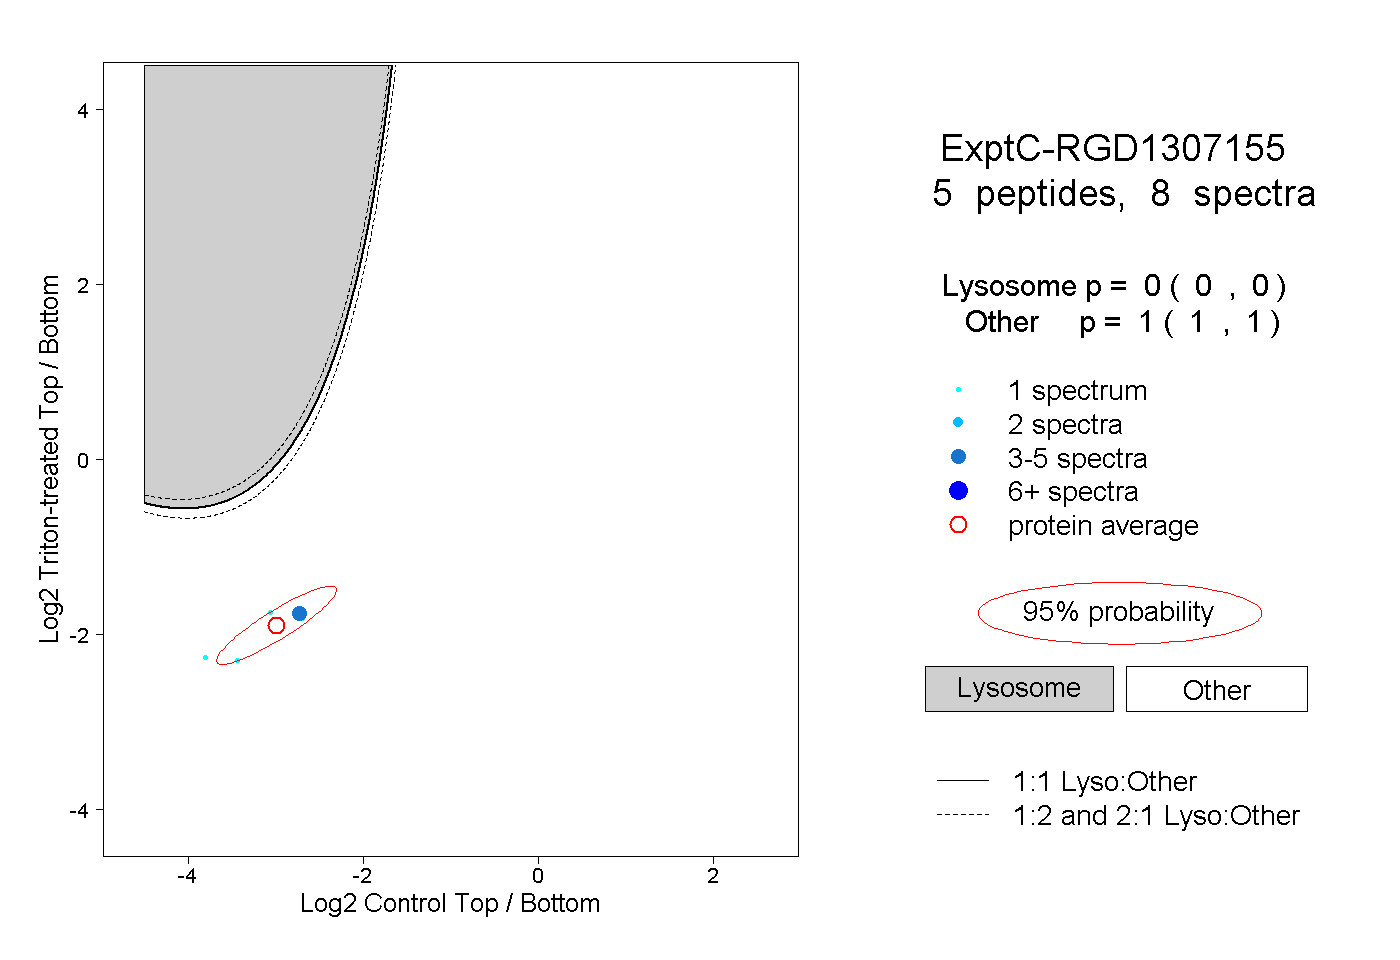
0.000 | 0.000
1.000 | 1.000
1peptide
spectrum
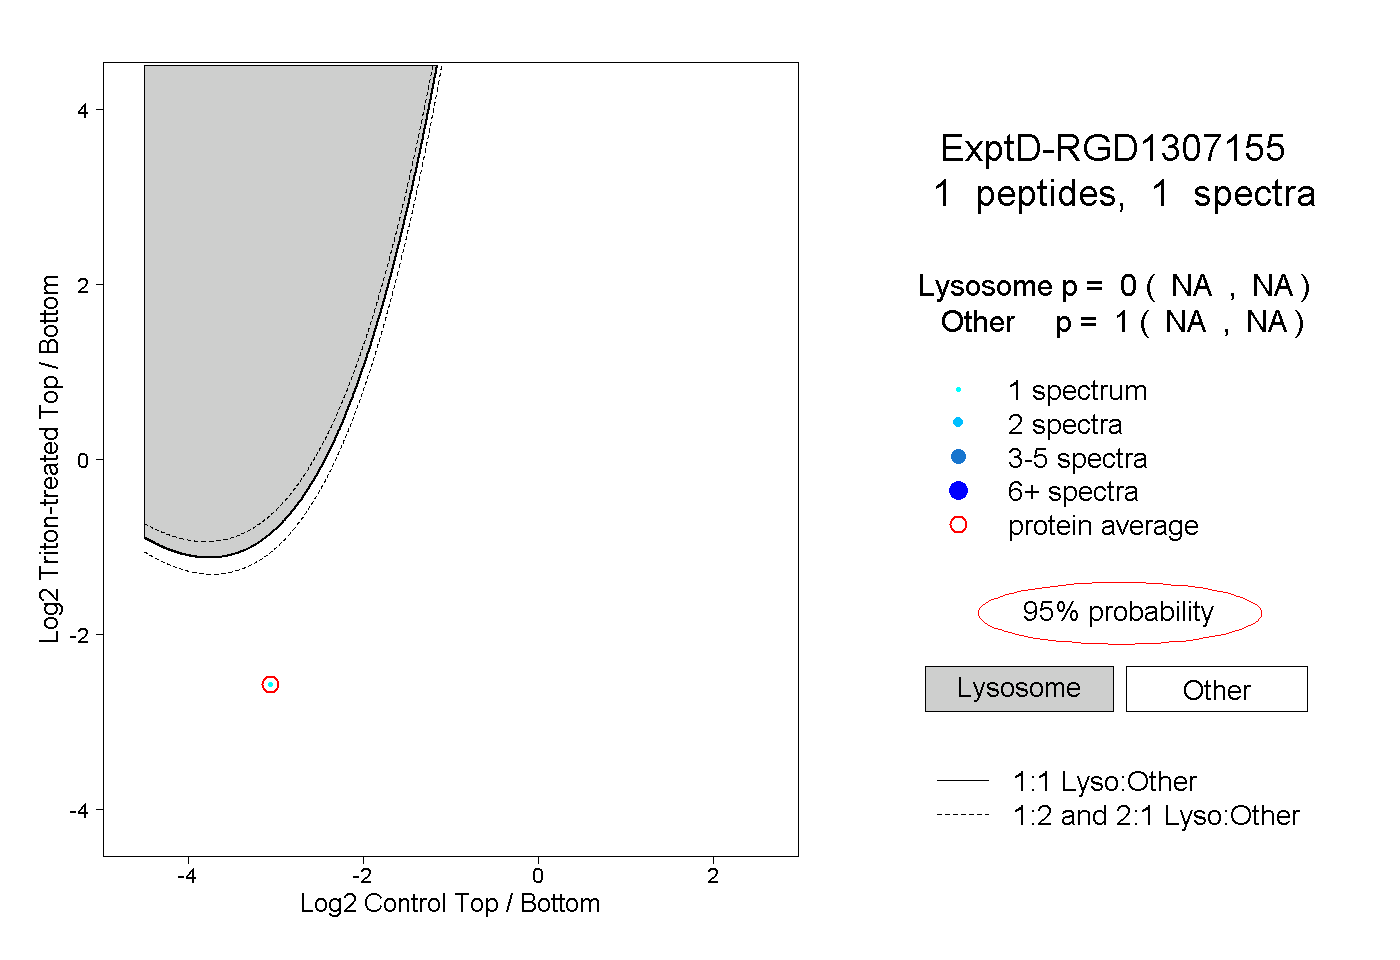
NA | NA
NA | NA