 7
7peptides
spectra
0.000 | 0.000
0.000 | 0.061
0.049 | 0.131
0.000 | 0.000
0.000 | 0.073
0.000 | 0.109
0.766 | 0.813
0.000 | 0.000
| Plot | Mito | Lyso | Perox | ER | Golgi | PM | Cytosol | Nucleus | |||||
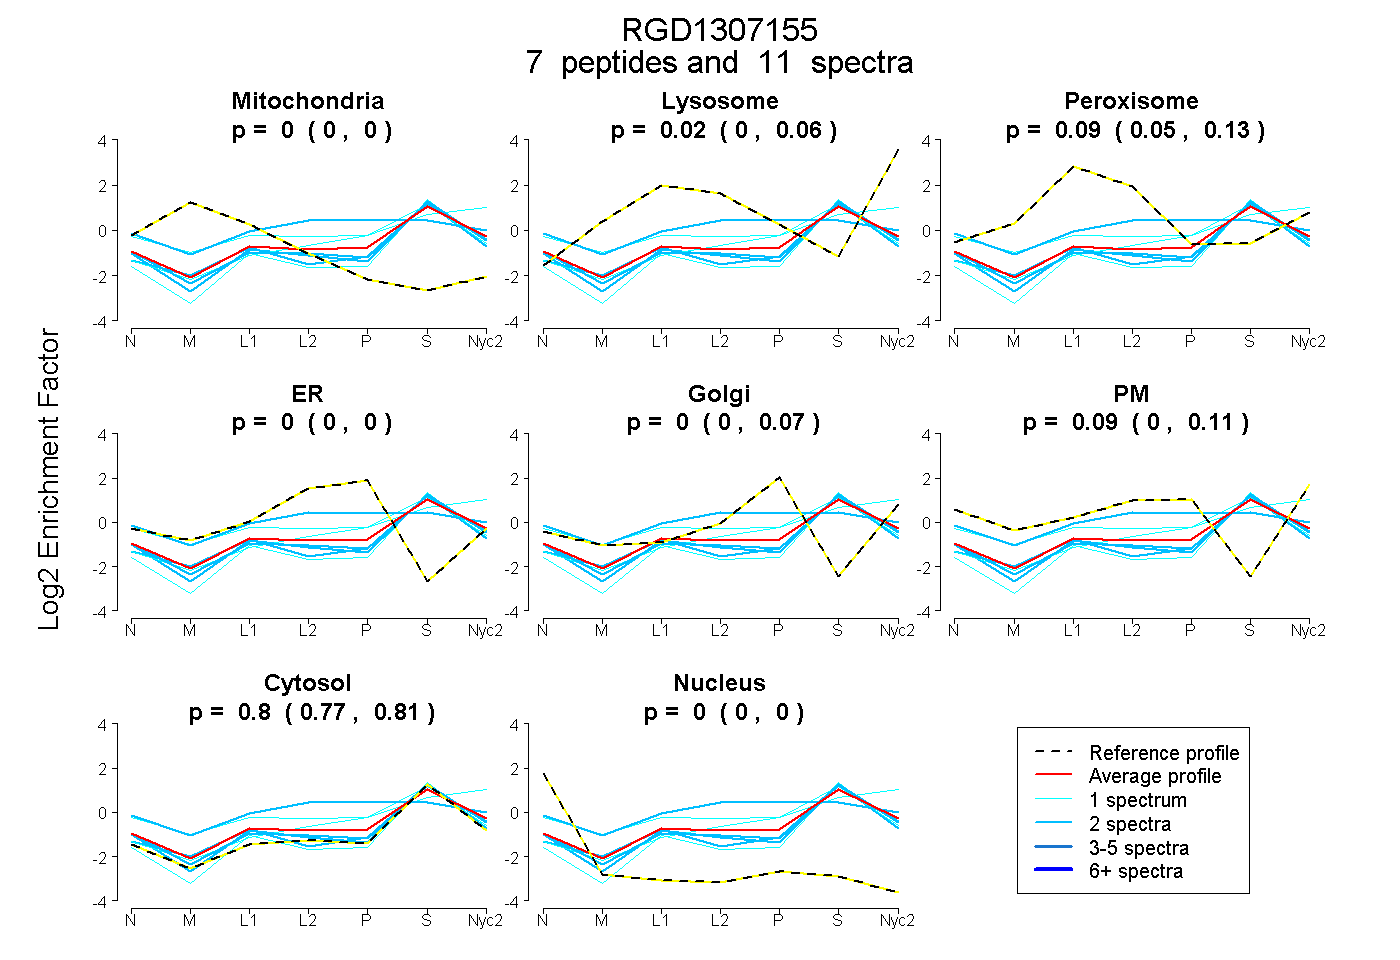
| Expt A |
7 peptides |
11 spectra |
|
0.000 0.000 | 0.000 |
0.024 0.000 | 0.061 |
0.091 0.049 | 0.131 |
0.000 0.000 | 0.000 |
0.001 0.000 | 0.073 |
0.088 0.000 | 0.109 |
0.797 0.766 | 0.813 |
0.000 0.000 | 0.000 |
| 2 spectra, AVLITYGPYAINGK | 0.032 | 0.000 | 0.075 | 0.000 | 0.000 | 0.000 | 0.893 | 0.000 | ||
| 1 spectrum, AAGHLLK | 0.000 | 0.000 | 0.000 | 0.000 | 0.000 | 0.000 | 1.000 | 0.000 | ||
| 2 spectra, VLEVASGSGQHAAHFAR | 0.000 | 0.000 | 0.225 | 0.176 | 0.000 | 0.158 | 0.441 | 0.000 | ||
| 2 spectra, ISPQSNVDFDLTLR | 0.000 | 0.000 | 0.085 | 0.000 | 0.000 | 0.000 | 0.915 | 0.000 | ||
| 1 spectrum, AFPNAEWQPSDVDQR | 0.000 | 0.214 | 0.036 | 0.000 | 0.000 | 0.219 | 0.531 | 0.000 | ||
| 2 spectra, QYVDPAQR | 0.000 | 0.000 | 0.070 | 0.000 | 0.000 | 0.047 | 0.883 | 0.000 | ||
| 1 spectrum, NPEWGLR | 0.000 | 0.031 | 0.000 | 0.128 | 0.027 | 0.000 | 0.814 | 0.000 |
| Plot | Lyso | Other | |||||||||||
| Expt C |
5 peptides |
8 spectra |
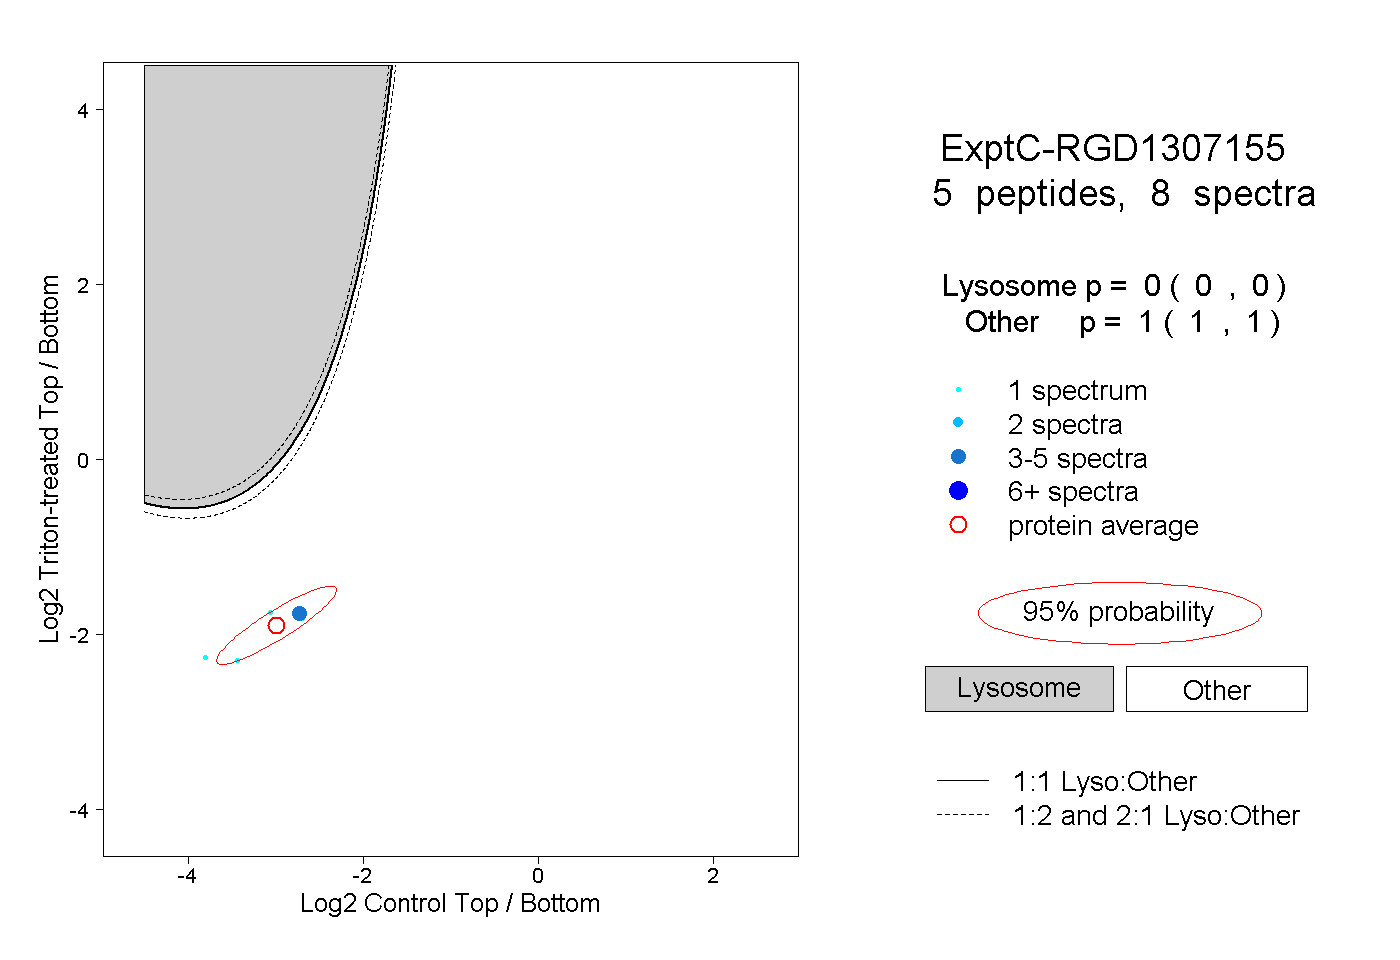 |
0.000 0.000 | 0.000 |
1.000 1.000 | 1.000 |
||||||||
| Plot | Lyso | Other | |||||||||||
| Expt D |
1 peptide |
1 spectrum |
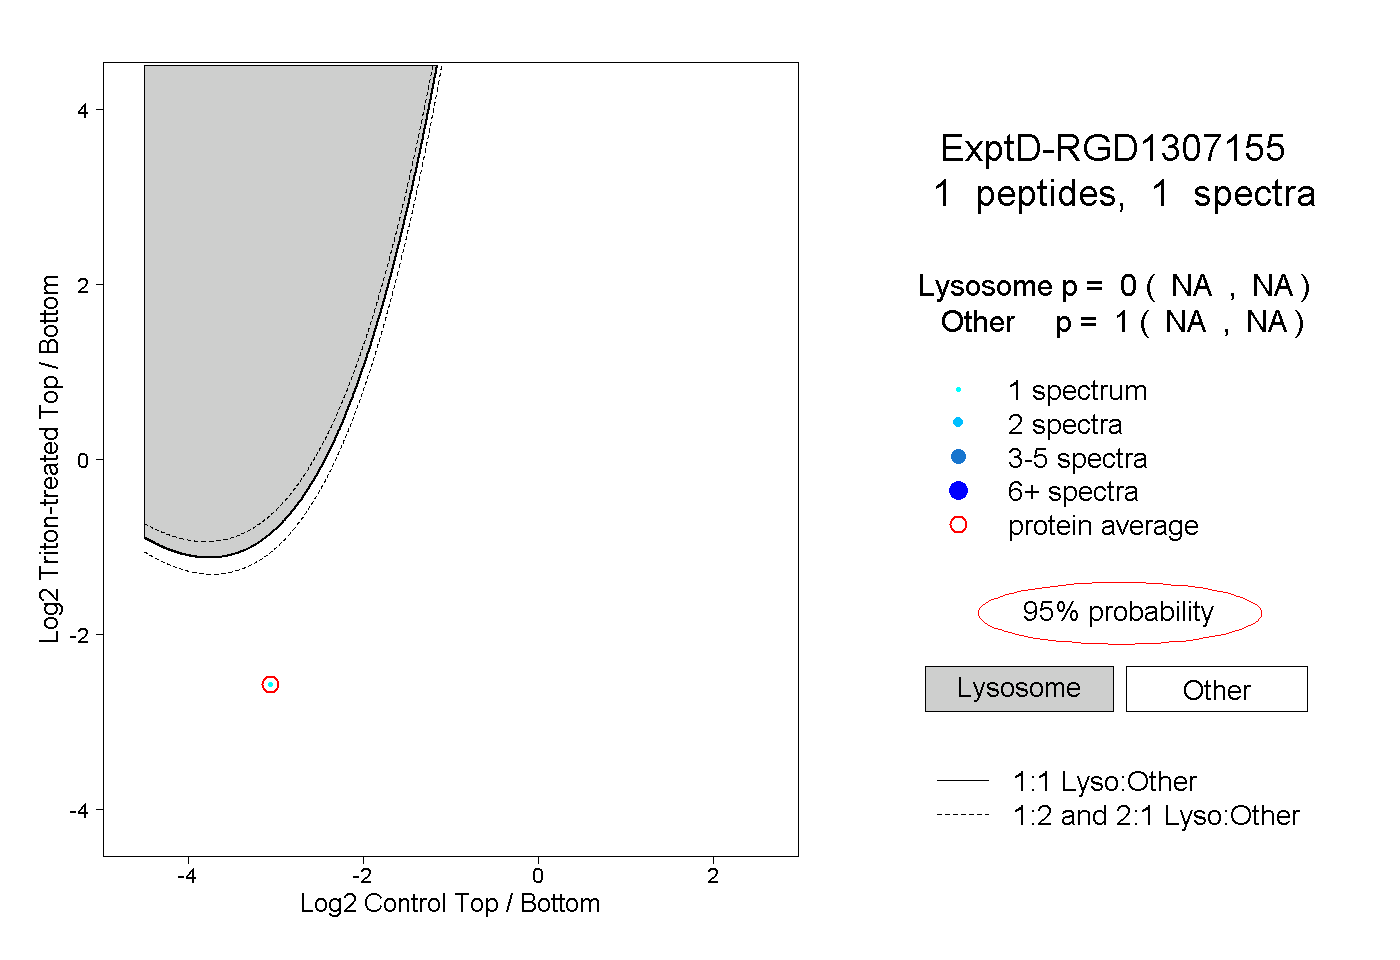 |
0.000 NA | NA |
1.000 NA | NA |