 9
9peptides
spectra
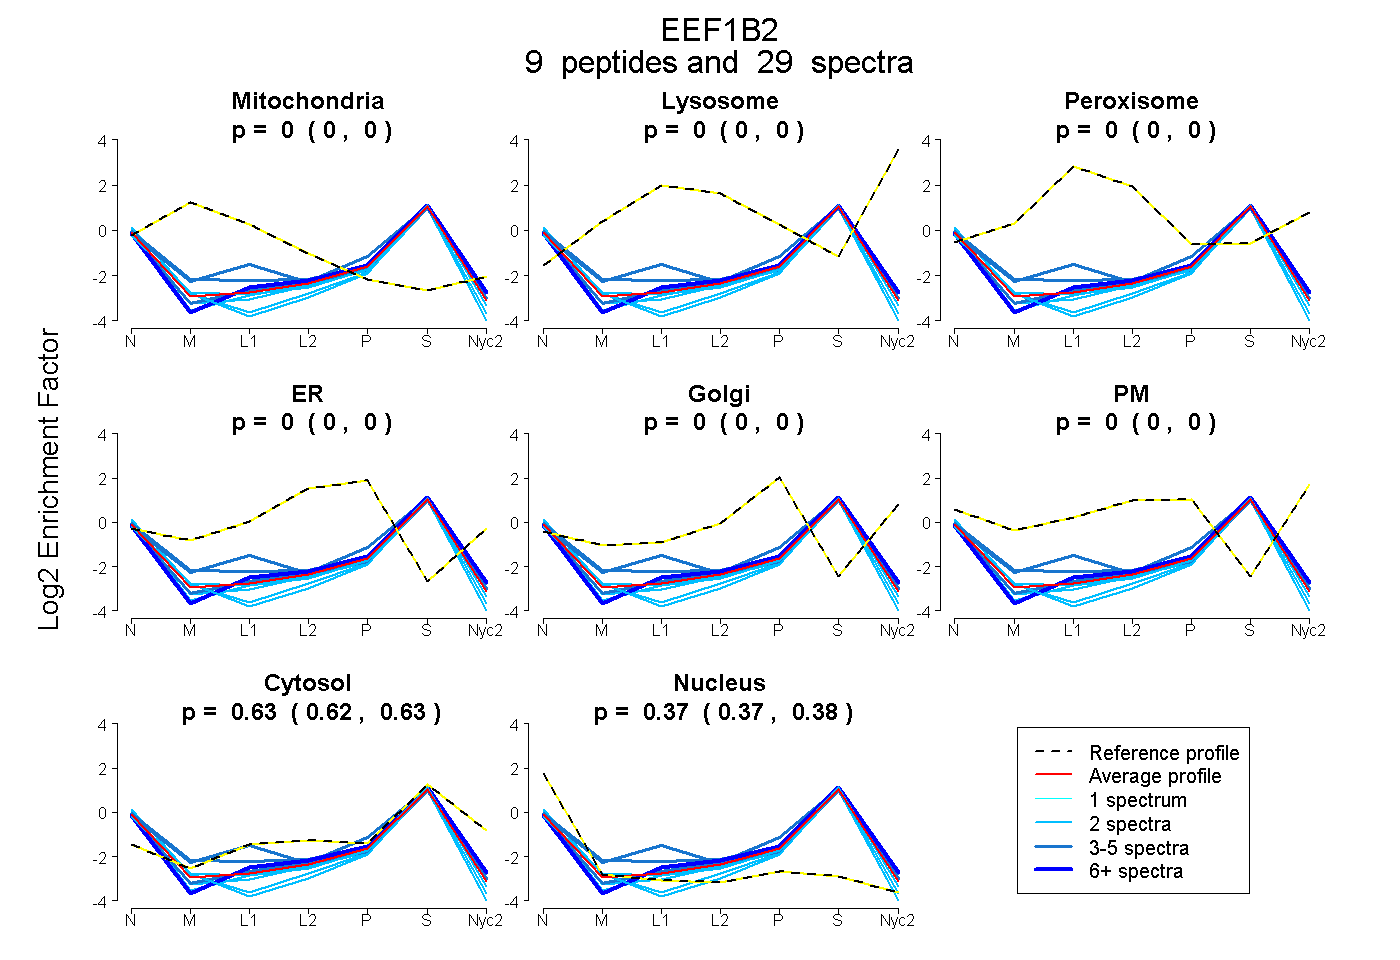
0.000 | 0.000
0.000 | 0.000
0.000 | 0.000
0.000 | 0.000
0.000 | 0.000
0.000 | 0.000
0.621 | 0.632
0.367 | 0.378
4peptides
spectra
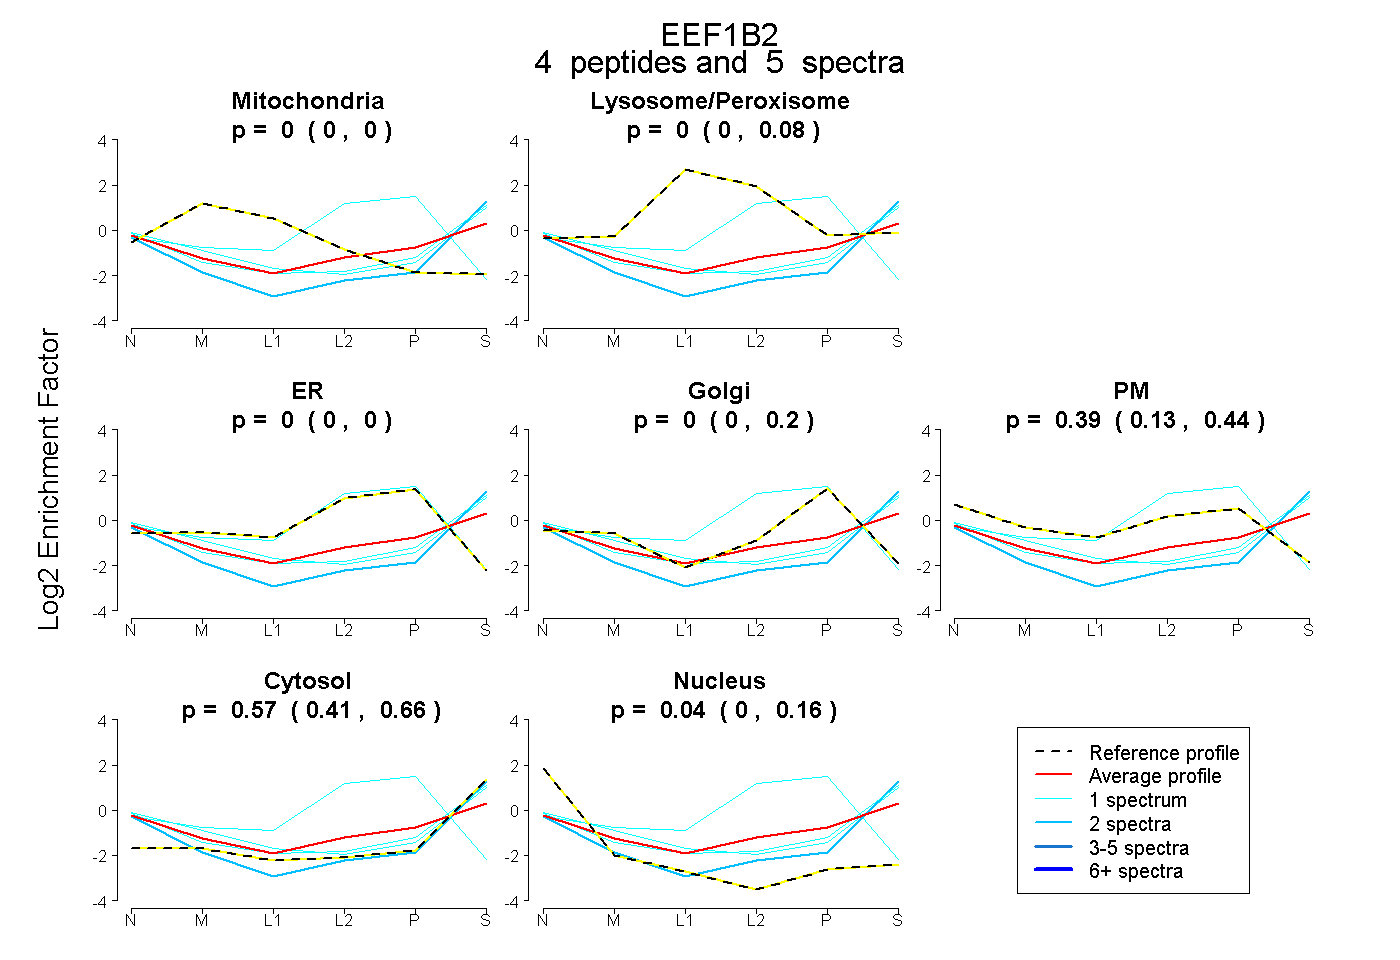
0.000 | 0.000
0.000 | 0.082
0.000 | 0.000
0.000 | 0.197
0.127 | 0.442
0.415 | 0.658
0.000 | 0.161
7peptides
spectra
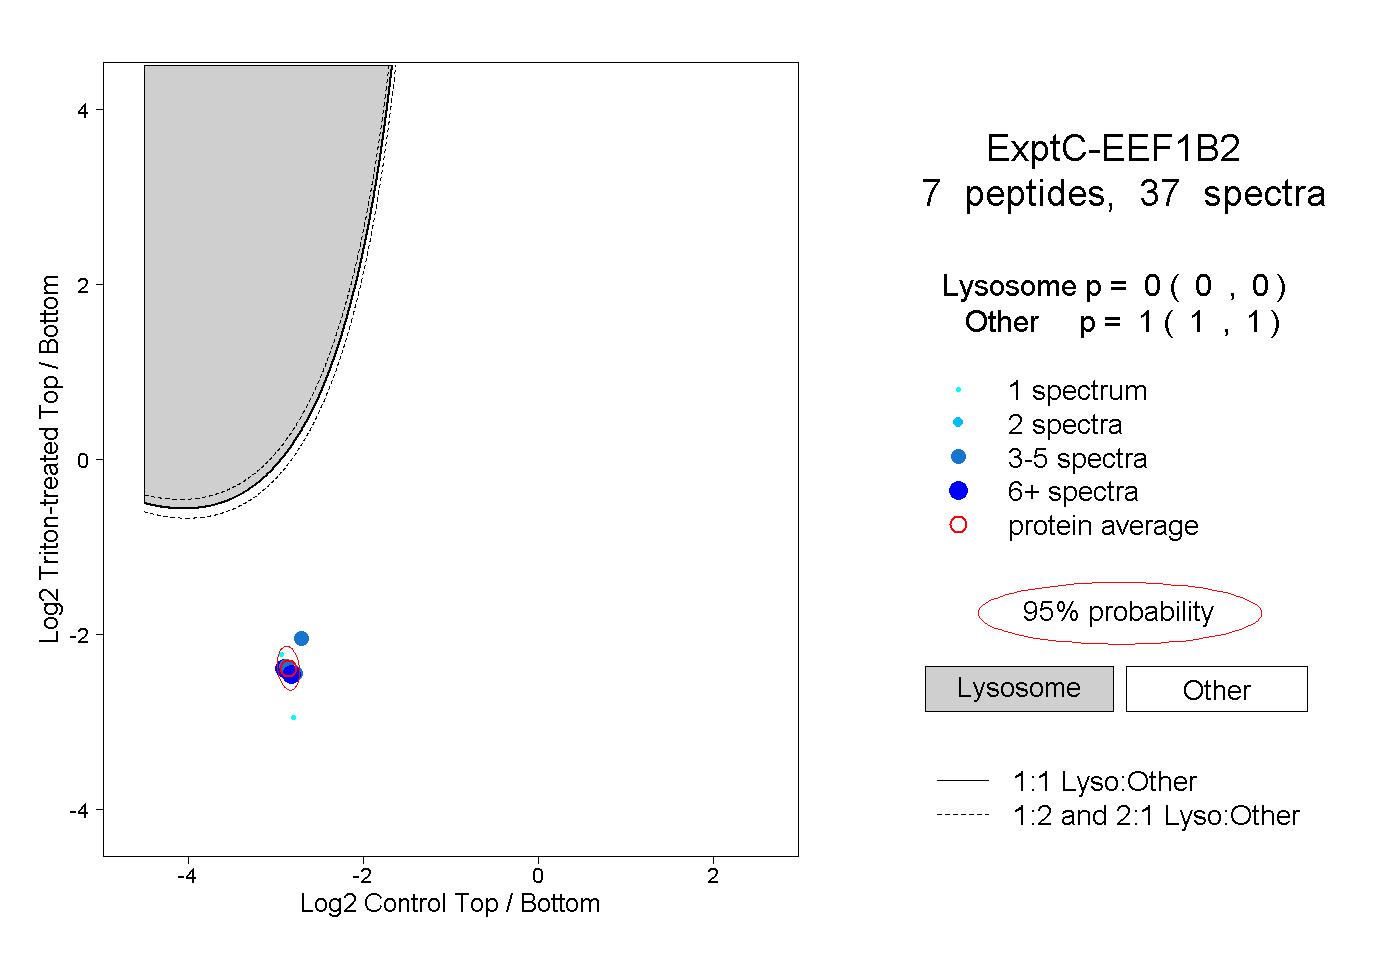
0.000 | 0.000
1.000 | 1.000
2peptides
spectra
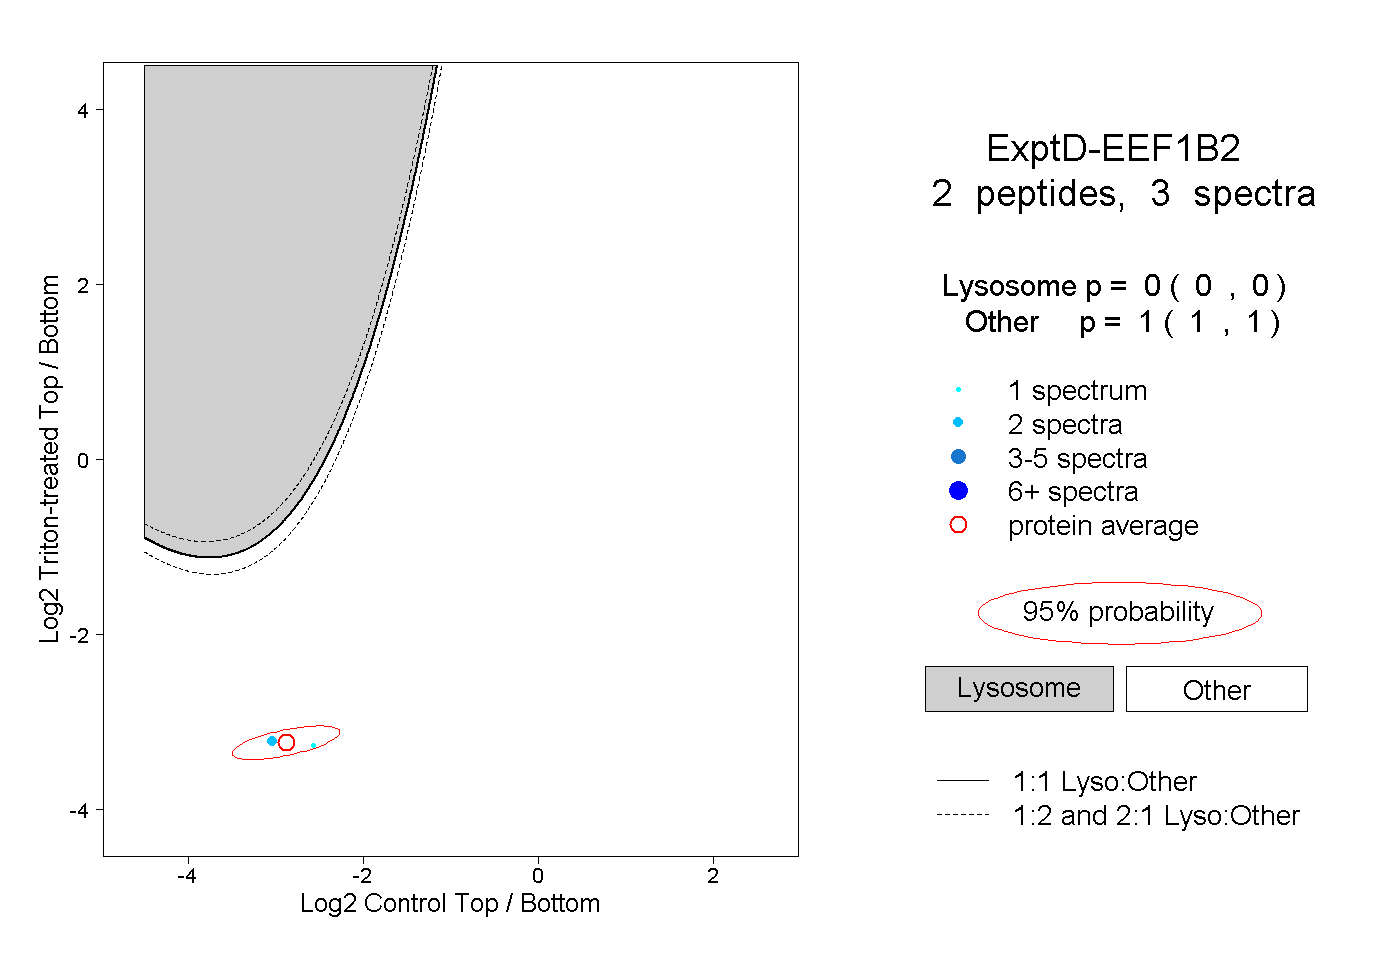
0.000 | 0.000
1.000 | 1.000