 9
9peptides
spectra
0.000 | 0.000
0.000 | 0.000
0.000 | 0.000
0.000 | 0.000
0.000 | 0.000
0.000 | 0.000
0.621 | 0.632
0.367 | 0.378
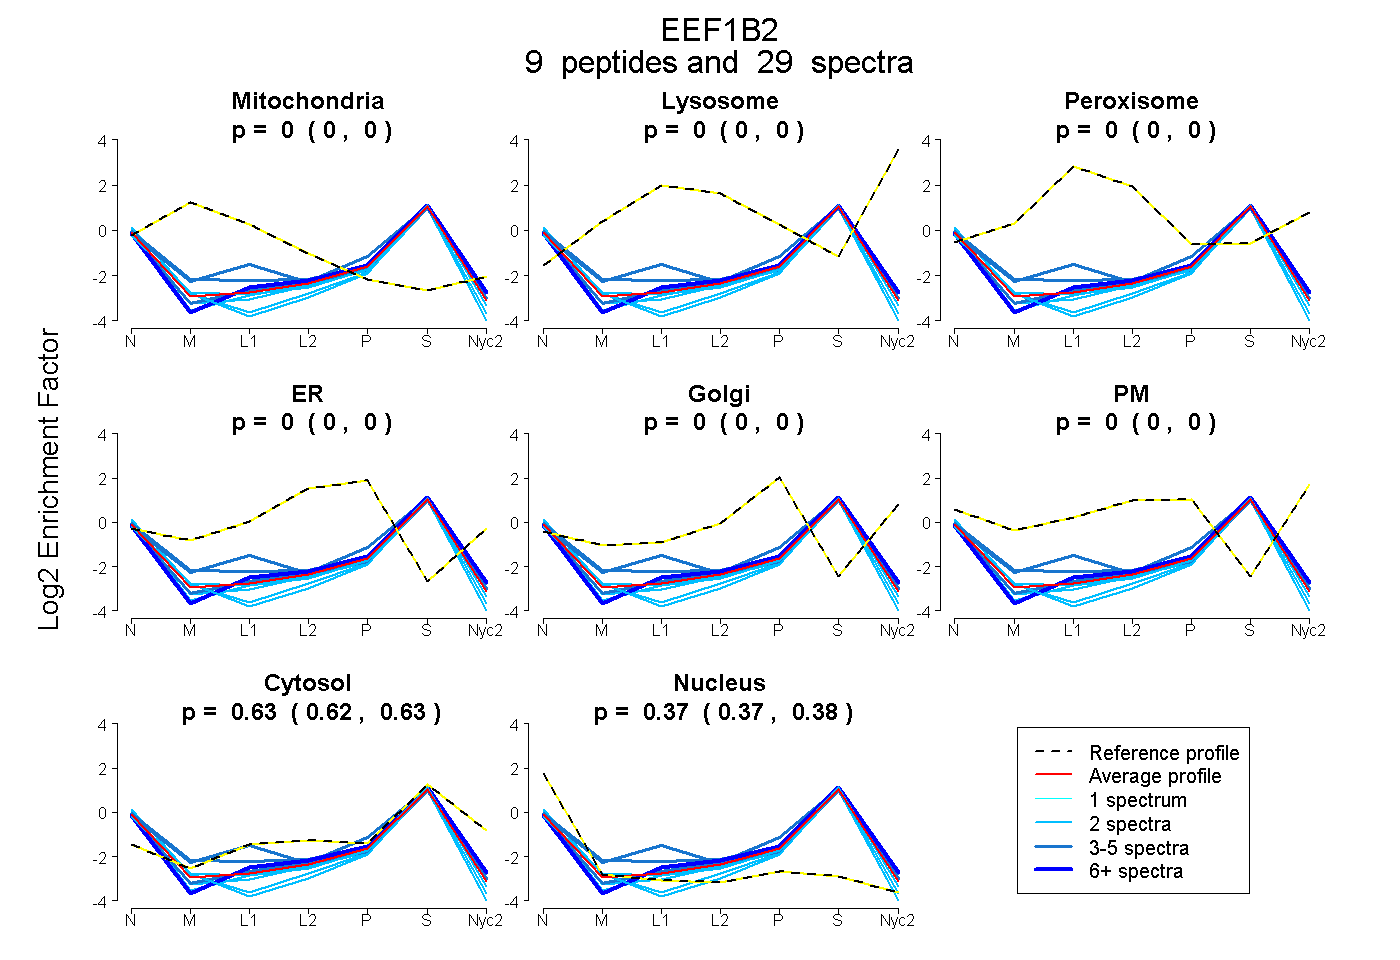
| Plot | Mito | Lyso | Perox | ER | Golgi | PM | Cytosol | Nucleus | |||||
| Expt A |
9 peptides |
29 spectra |
|
0.000 0.000 | 0.000 |
0.000 0.000 | 0.000 |
0.000 0.000 | 0.000 |
0.000 0.000 | 0.000 |
0.000 0.000 | 0.000 |
0.000 0.000 | 0.000 |
0.627 0.621 | 0.632 |
0.373 0.367 | 0.378 |
| 2 spectra, KPAVVAK | 0.000 | 0.000 | 0.000 | 0.000 | 0.000 | 0.000 | 0.487 | 0.513 | ||
| 6 spectra, SIQADGLVWGSSK | 0.000 | 0.000 | 0.000 | 0.000 | 0.000 | 0.000 | 0.674 | 0.326 | ||
| 2 spectra, WYNHIK | 0.000 | 0.000 | 0.000 | 0.000 | 0.000 | 0.000 | 0.613 | 0.387 | ||
| 5 spectra, LVPVGYGIK | 0.000 | 0.000 | 0.000 | 0.000 | 0.000 | 0.000 | 0.701 | 0.299 | ||
| 4 spectra, LEECVR | 0.000 | 0.000 | 0.000 | 0.000 | 0.000 | 0.000 | 0.662 | 0.338 | ||
| 2 spectra, ASLPGVK | 0.000 | 0.000 | 0.000 | 0.000 | 0.000 | 0.000 | 0.605 | 0.395 | ||
| 4 spectra, LAQYESK | 0.000 | 0.000 | 0.000 | 0.000 | 0.000 | 0.000 | 0.661 | 0.339 | ||
| 2 spectra, GFGDLK | 0.000 | 0.000 | 0.000 | 0.000 | 0.000 | 0.000 | 0.567 | 0.433 | ||
| 2 spectra, TPAGLQVLNDYLADK | 0.000 | 0.000 | 0.000 | 0.000 | 0.000 | 0.000 | 0.506 | 0.494 |
| Plot | Mito | Lyso or Perox | ER | Golgi | PM | Cytosol | Nucleus | ||||||
| Expt B |
4 peptides |
5 spectra |
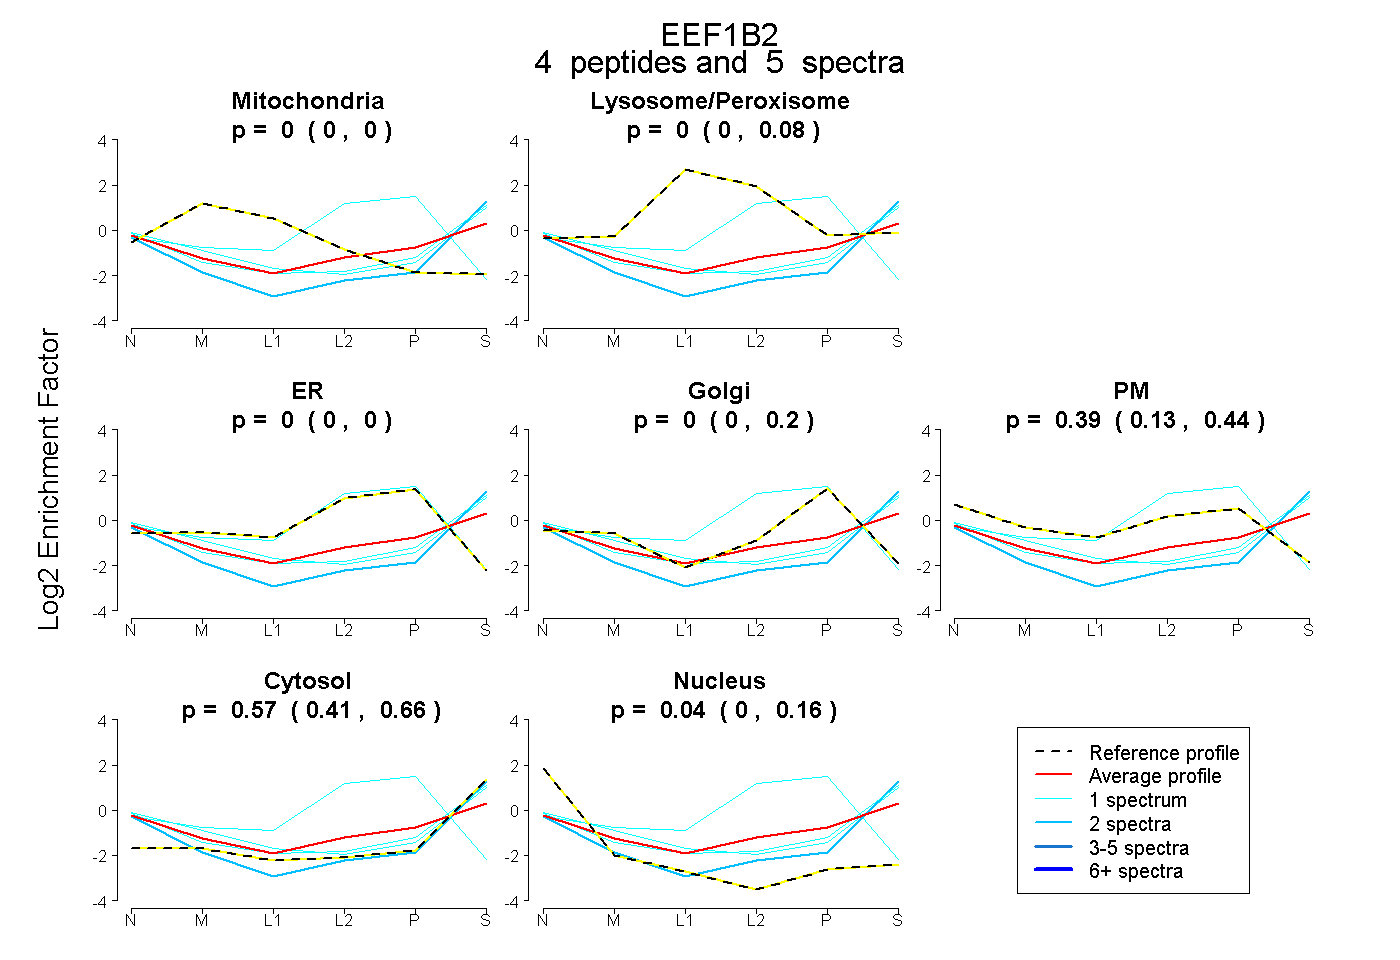 |
0.000 0.000 | 0.000 |
0.000 0.000 | 0.082 |
0.000 0.000 | 0.000 |
0.000 0.000 | 0.197 |
0.385 0.127 | 0.442 |
0.572 0.415 | 0.658 |
0.043 0.000 | 0.161 |
|||
| Plot | Lyso | Other | |||||||||||
| Expt C |
7 peptides |
37 spectra |
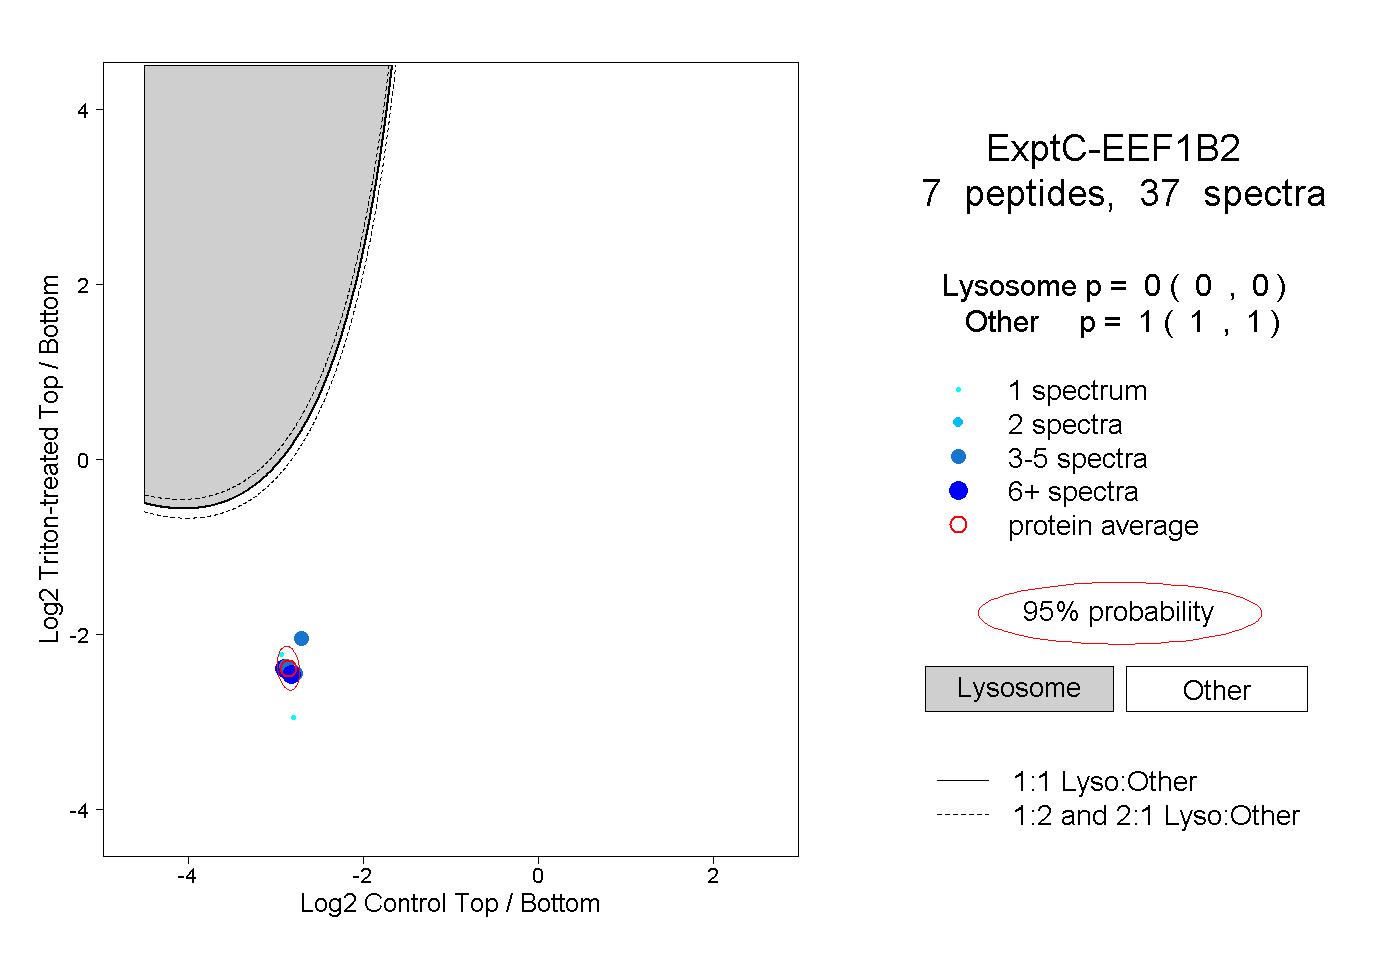 |
0.000 0.000 | 0.000 |
1.000 1.000 | 1.000 |
||||||||
| Plot | Lyso | Other | |||||||||||
| Expt D |
2 peptides |
3 spectra |
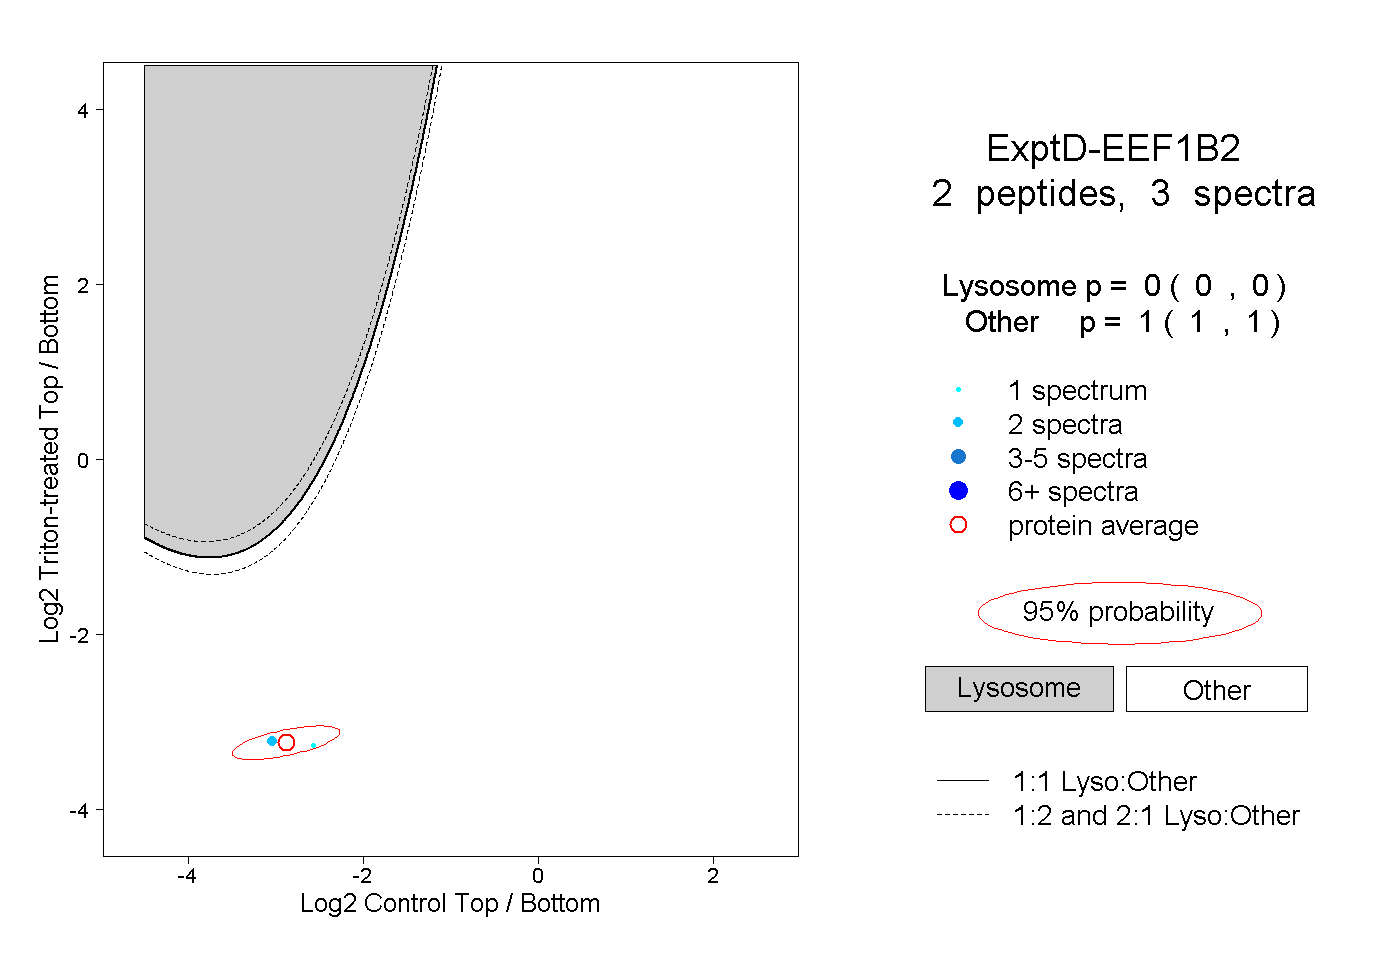 |
0.000 0.000 | 0.000 |
1.000 1.000 | 1.000 |