 5
5peptides
spectra
0.000 | 0.000
0.000 | 0.000
0.000 | 0.109
0.313 | 0.628
0.000 | 0.091
0.000 | 0.278
0.137 | 0.344
0.010 | 0.146
2peptides
spectra
0.000 | 0.003
0.996 | 1.000
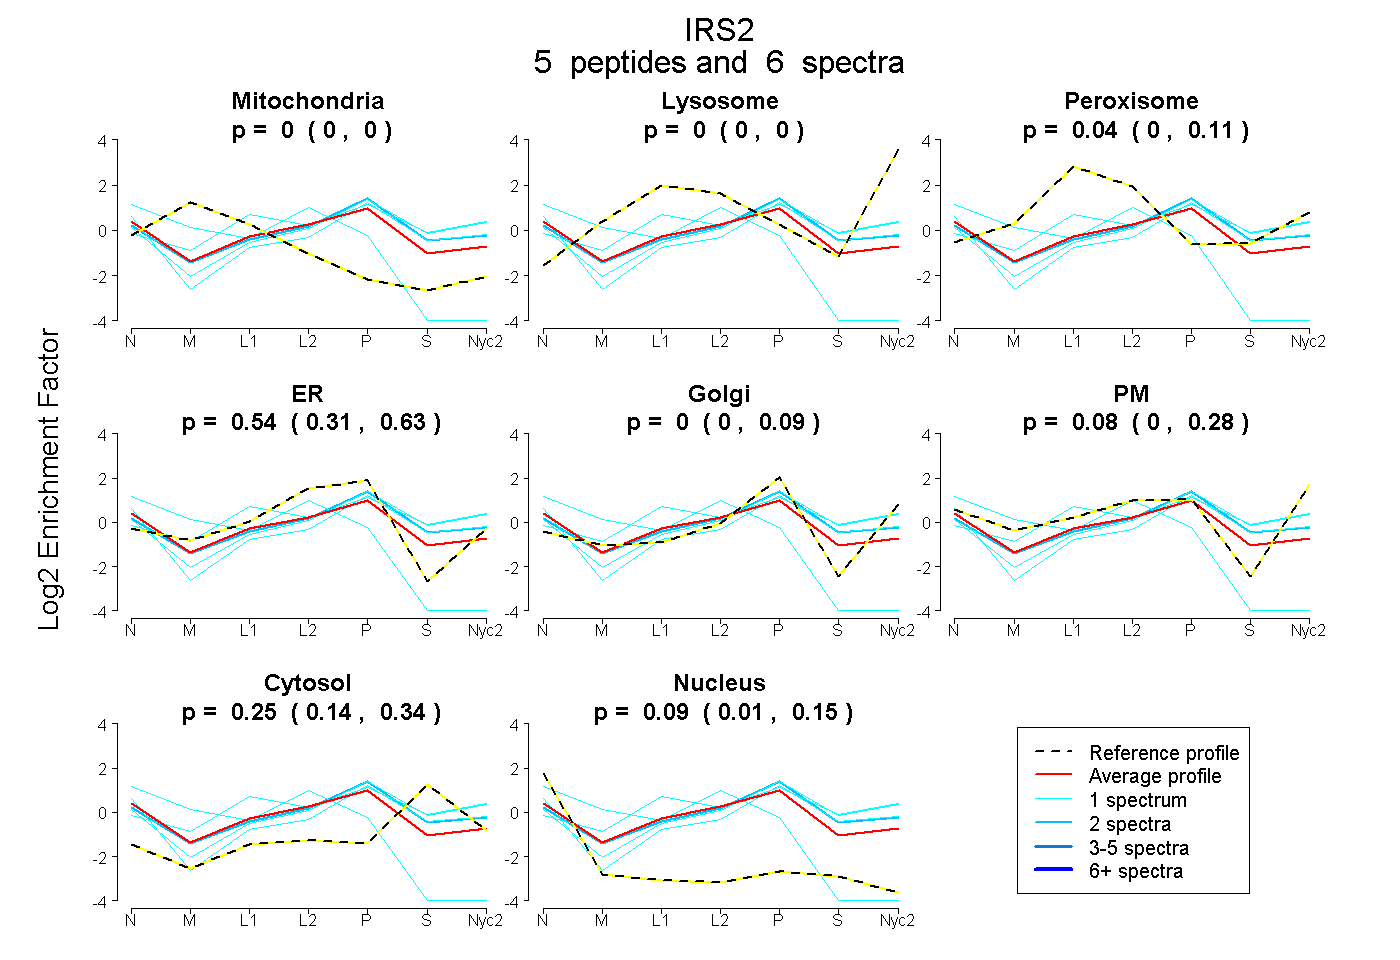
| Plot | Mito | Lyso | Perox | ER | Golgi | PM | Cytosol | Nucleus | |||||
| Expt A |
5 peptides |
6 spectra |
|
0.000 0.000 | 0.000 |
0.000 0.000 | 0.000 |
0.041 0.000 | 0.109 |
0.536 0.313 | 0.628 |
0.000 0.000 | 0.091 |
0.081 0.000 | 0.278 |
0.255 0.137 | 0.344 |
0.087 0.010 | 0.146 |
||
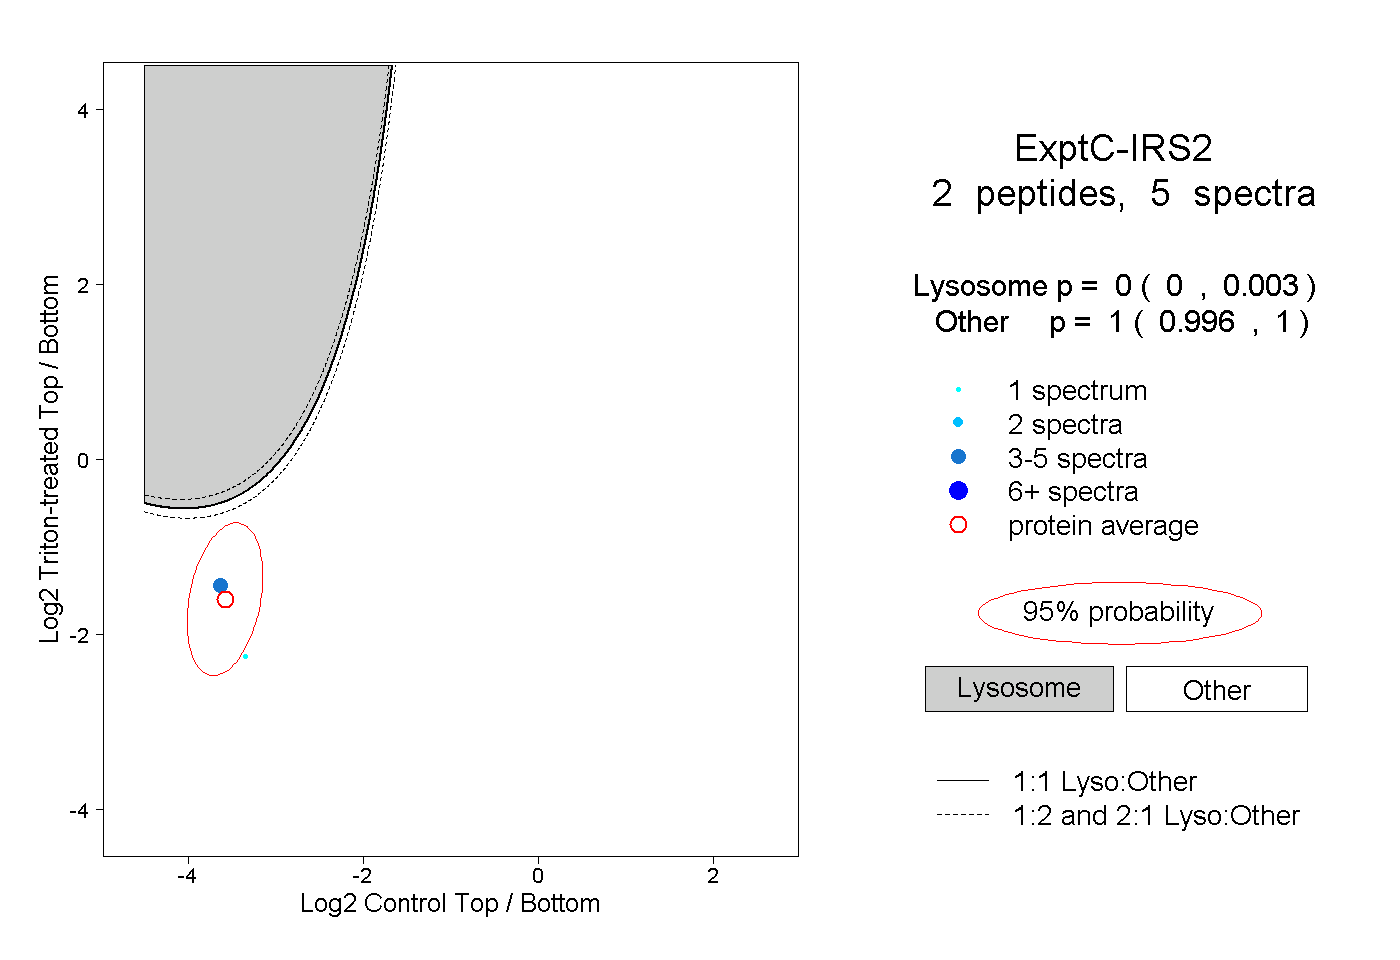
| Plot | Lyso | Other | |||||||||||
| Expt C |
2 peptides |
5 spectra |
|
0.000 0.000 | 0.003 |
1.000 0.996 | 1.000 |