 5
5peptides
spectra
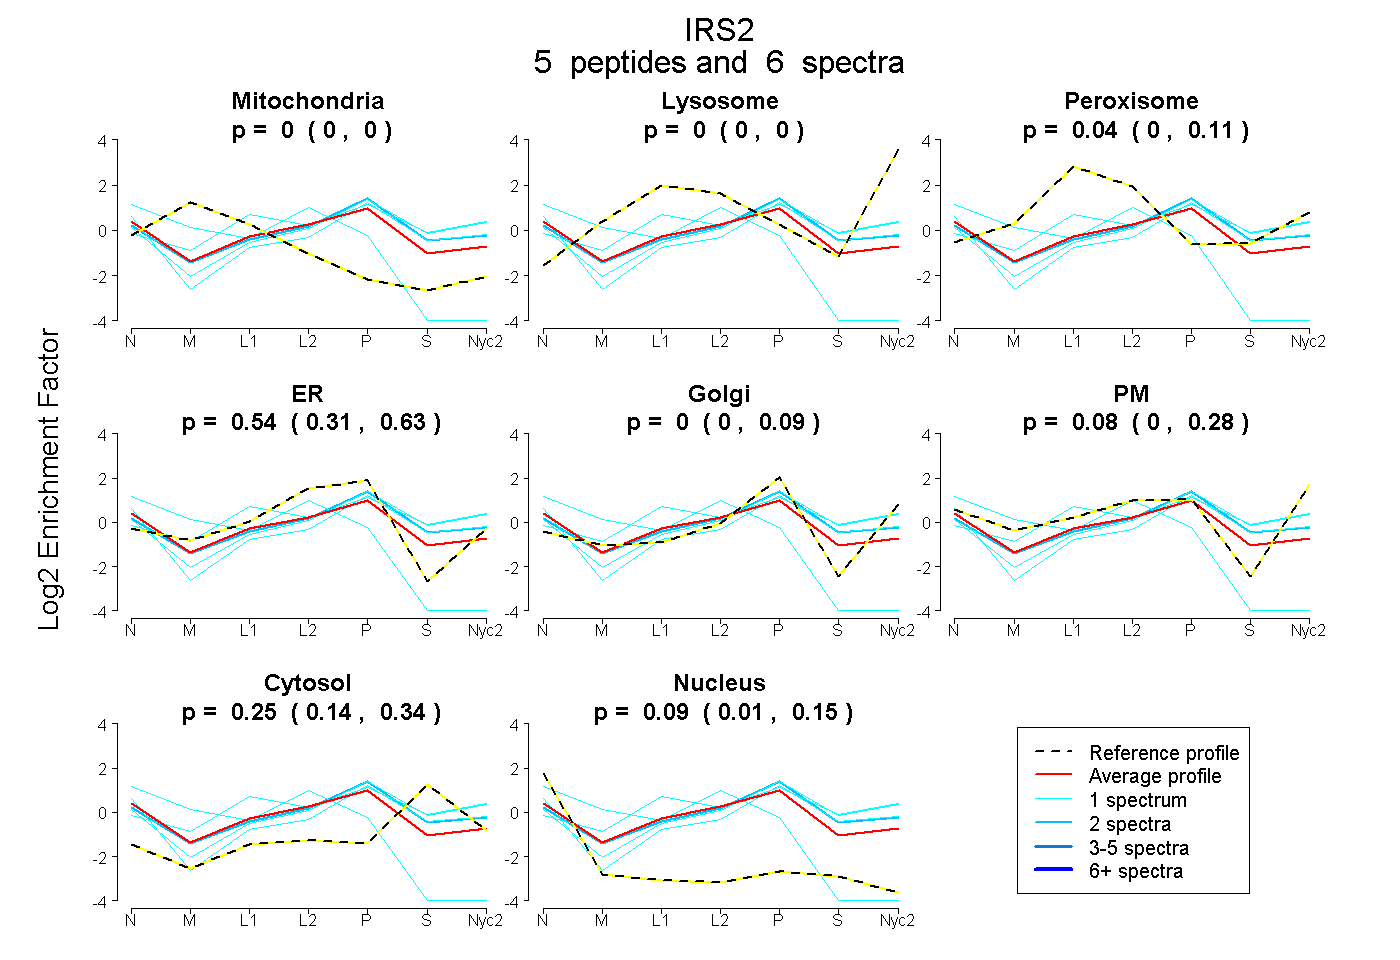
0.000 | 0.000
0.000 | 0.000
0.000 | 0.109
0.313 | 0.628
0.000 | 0.091
0.000 | 0.278
0.137 | 0.344
0.010 | 0.146
| Plot | Mito | Lyso | Perox | ER | Golgi | PM | Cytosol | Nucleus | |||||
| Expt A |
5 peptides |
6 spectra |
|
0.000 0.000 | 0.000 |
0.000 0.000 | 0.000 |
0.041 0.000 | 0.109 |
0.536 0.313 | 0.628 |
0.000 0.000 | 0.091 |
0.081 0.000 | 0.278 |
0.255 0.137 | 0.344 |
0.087 0.010 | 0.146 |
| 1 spectrum, VSGDGAQDLDR | 0.000 | 0.000 | 0.000 | 0.131 | 0.283 | 0.204 | 0.382 | 0.000 | ||
| 1 spectrum, GPGTGGEEAAAAGGSPPQPPR | 0.385 | 0.000 | 0.000 | 0.405 | 0.000 | 0.000 | 0.000 | 0.210 | ||
| 1 spectrum, VALAPAGGALQHSR | 0.000 | 0.000 | 0.381 | 0.000 | 0.408 | 0.000 | 0.211 | 0.000 | ||
| 2 spectra, ALTDLVSEGR | 0.000 | 0.000 | 0.000 | 0.384 | 0.151 | 0.123 | 0.342 | 0.000 | ||
| 1 spectrum, ELFEFRPR | 0.000 | 0.000 | 0.000 | 0.161 | 0.355 | 0.059 | 0.373 | 0.052 |
| Plot | Lyso | Other | |||||||||||
| Expt C |
2 peptides |
5 spectra |
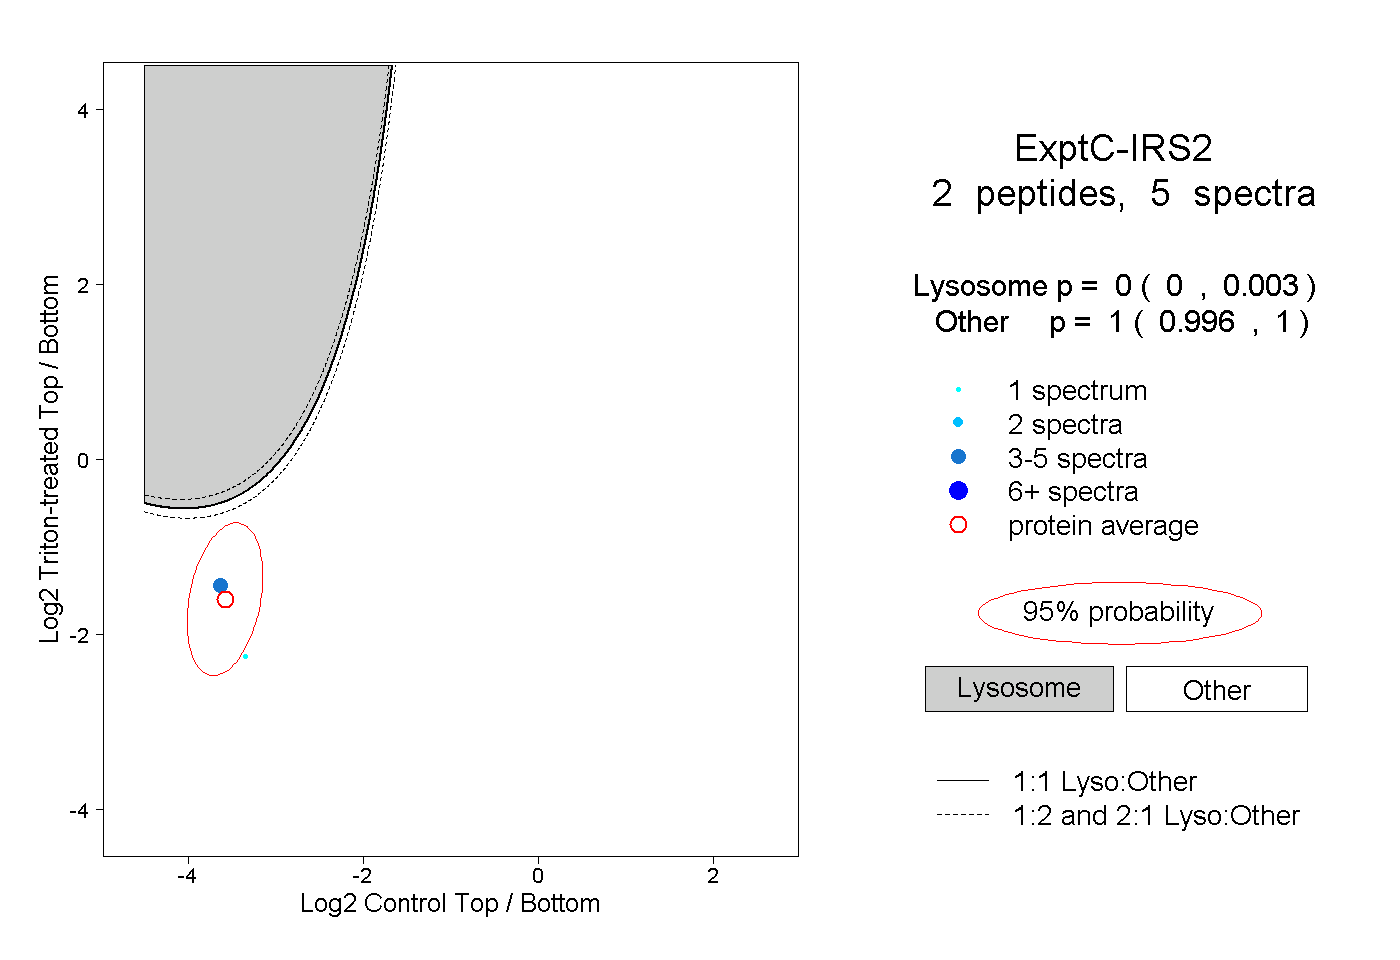 |
0.000 0.000 | 0.003 |
1.000 0.996 | 1.000 |