 4
4peptides
spectra
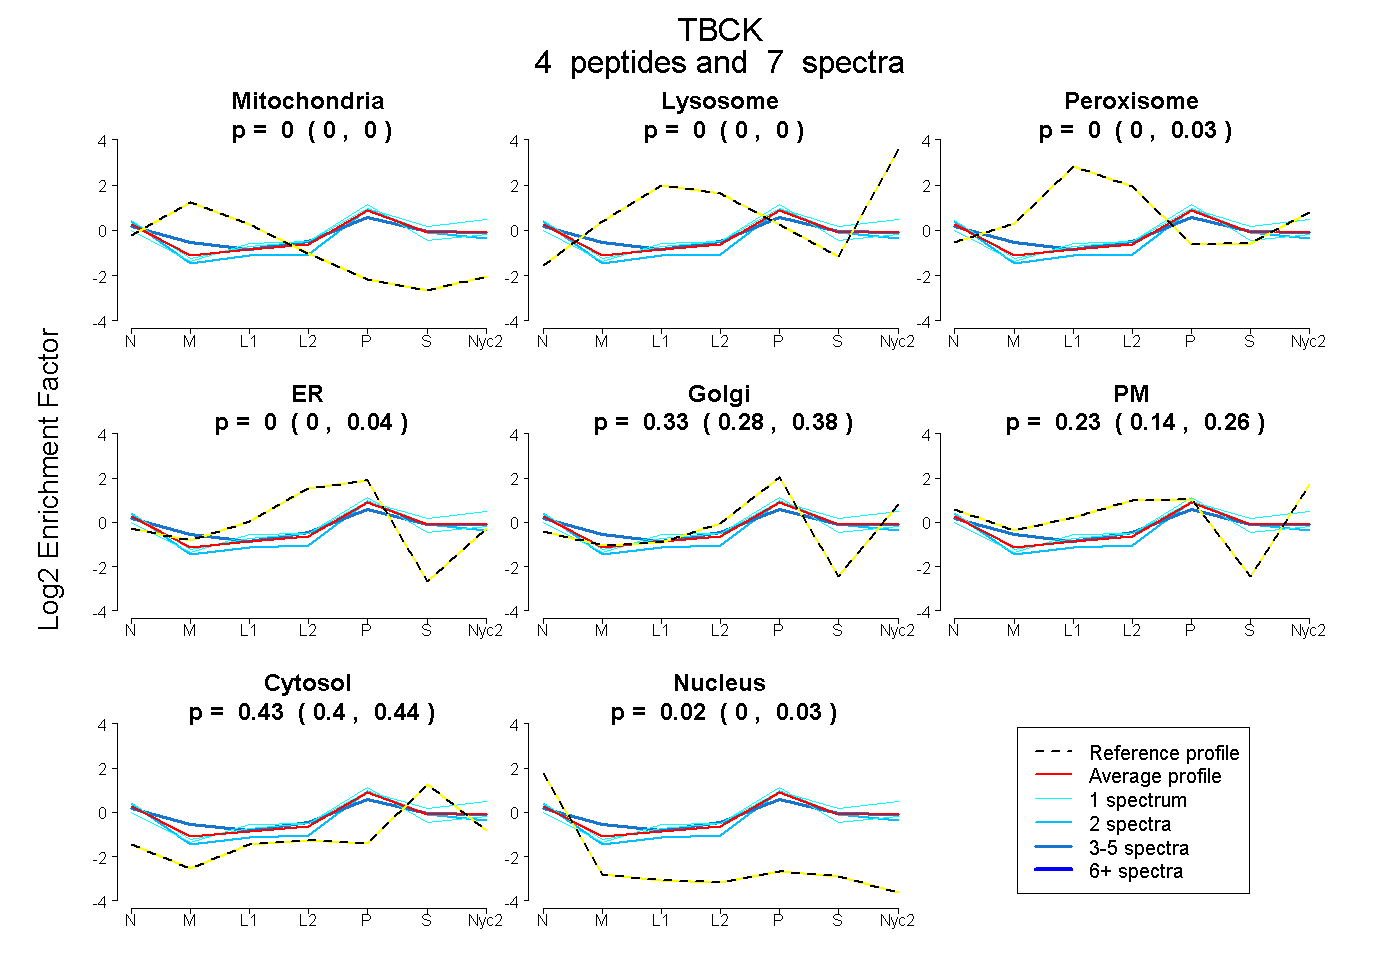
0.000 | 0.002
0.000 | 0.000
0.000 | 0.031
0.000 | 0.035
0.276 | 0.379
0.144 | 0.259
0.401 | 0.442
0.001 | 0.029
1peptide
spectrum
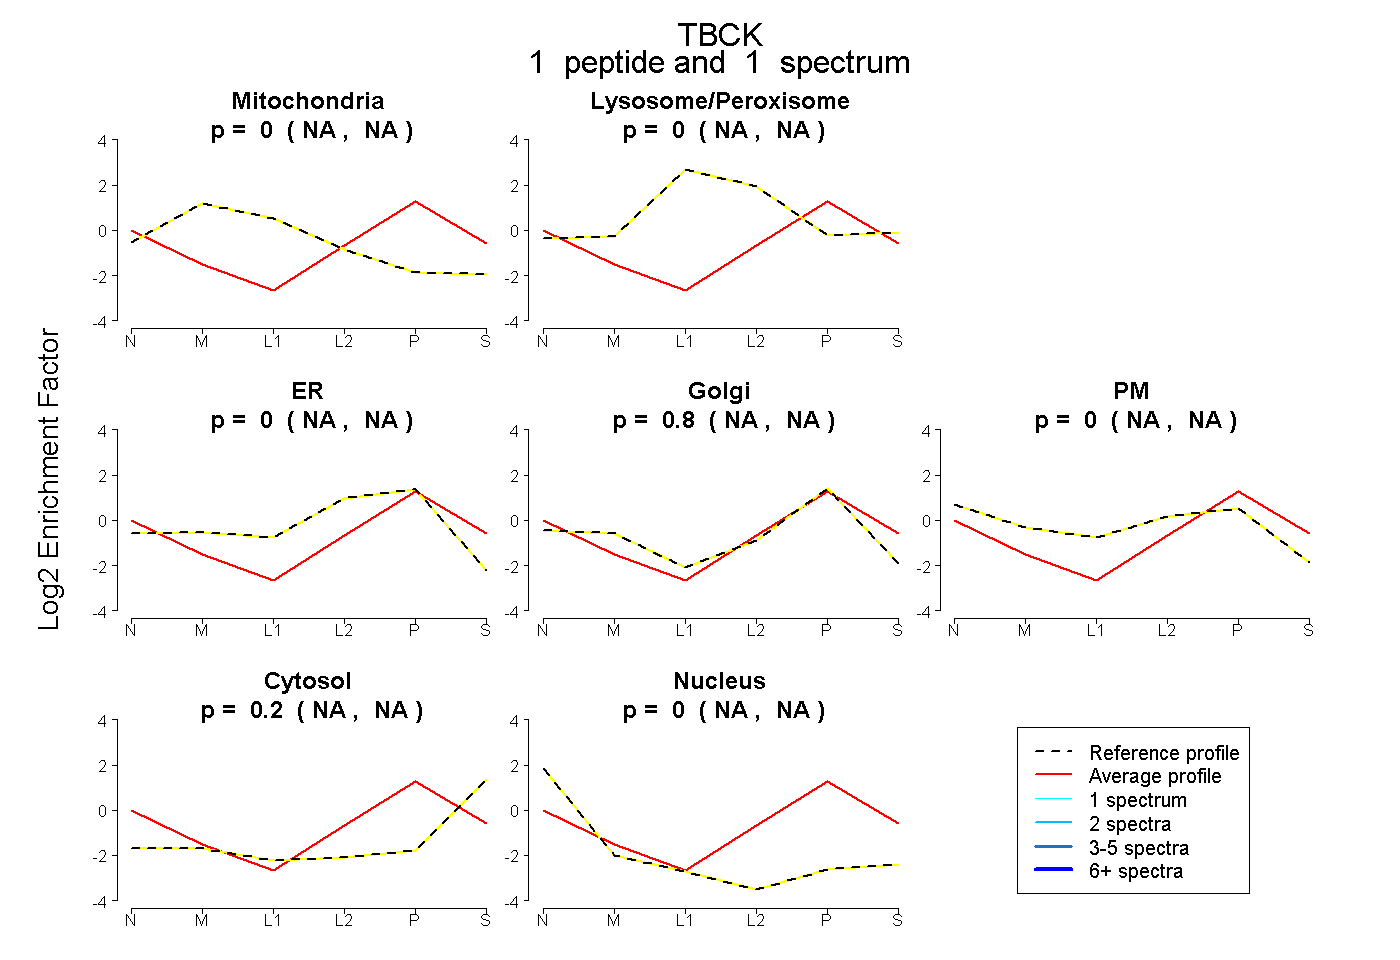
NA | NA
NA | NA
NA | NA
NA | NA
NA | NA
NA | NA
NA | NA
6peptides
spectra
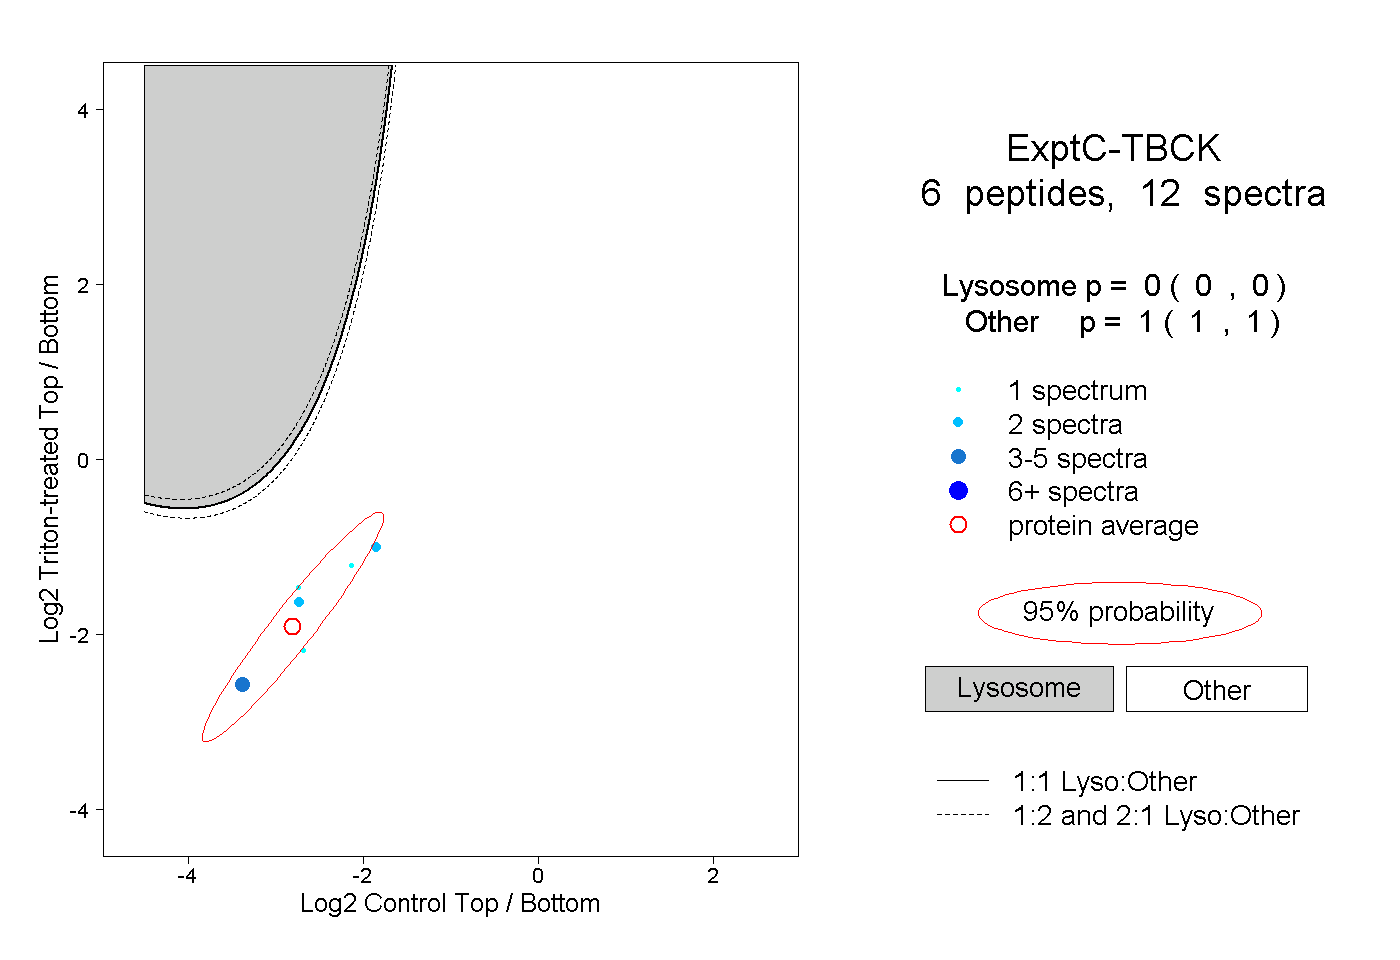
0.000 | 0.000
1.000 | 1.000