TBCK
[ENSRNOP00000036851]
Main page
| | | Plot |
Mito |
Lyso |
|
Perox |
ER |
Golgi |
PM |
Cytosol |
Nucleus |
|
| Expt A |
 4
4
peptides |
7
spectra |
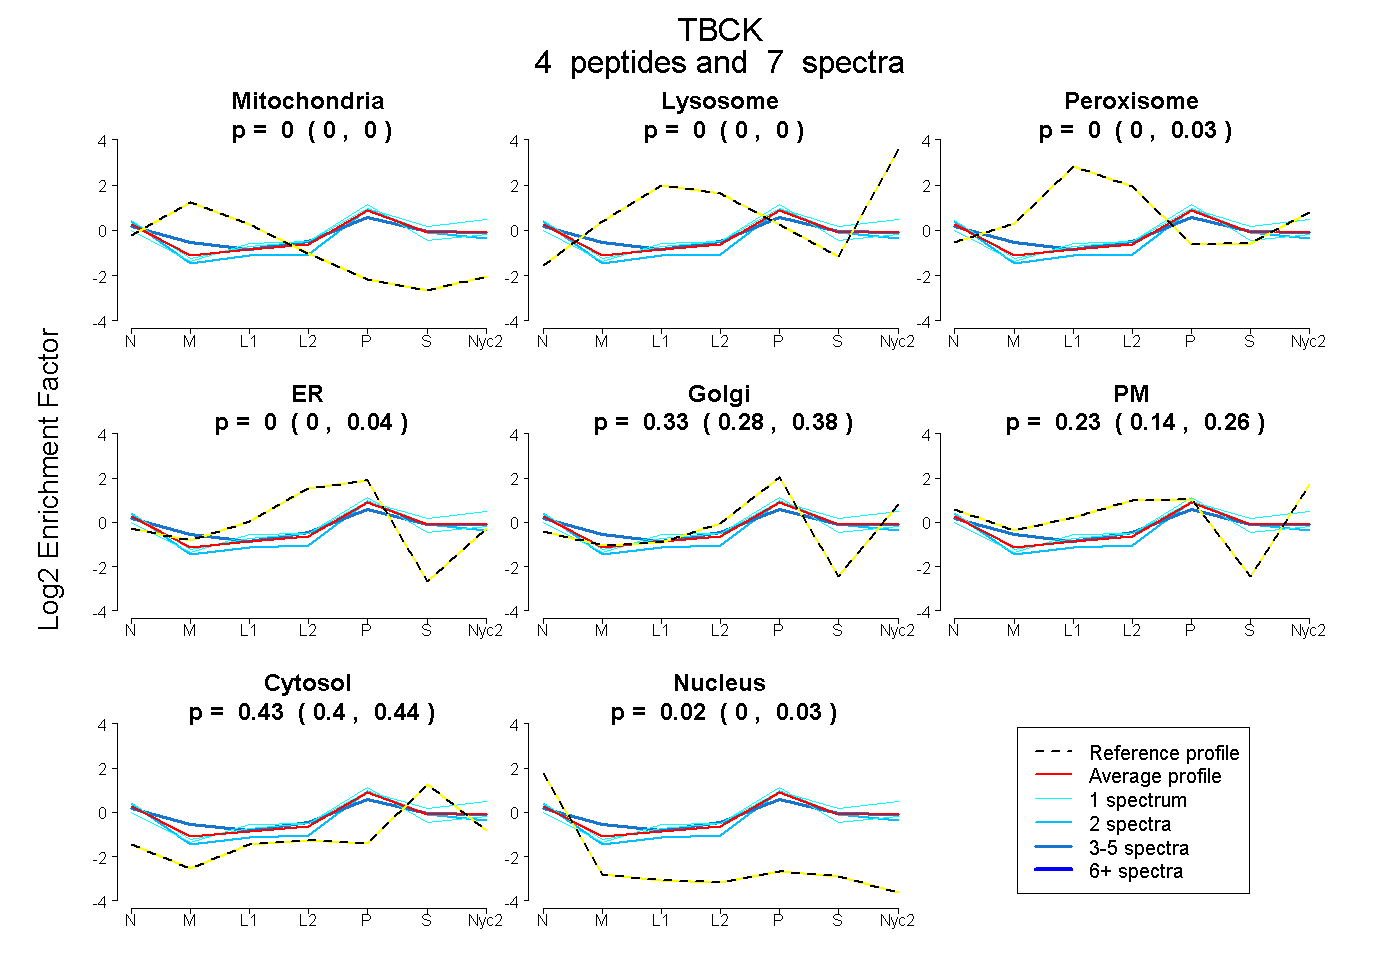 |
0.000
0.000 | 0.002 |
0.000
0.000 | 0.000 |
|
0.001
0.000 | 0.031 |
0.000
0.000 | 0.035 |
0.328
0.276 | 0.379 |
0.226
0.144 | 0.259 |
0.429
0.401 | 0.442 |
0.015
0.001 | 0.029 |
|
| | | Plot |
Mito |
|
Lyso or Perox |
|
ER |
Golgi |
PM |
Cytosol |
Nucleus |
|
| Expt B |
1
peptide |
1
spectrum |
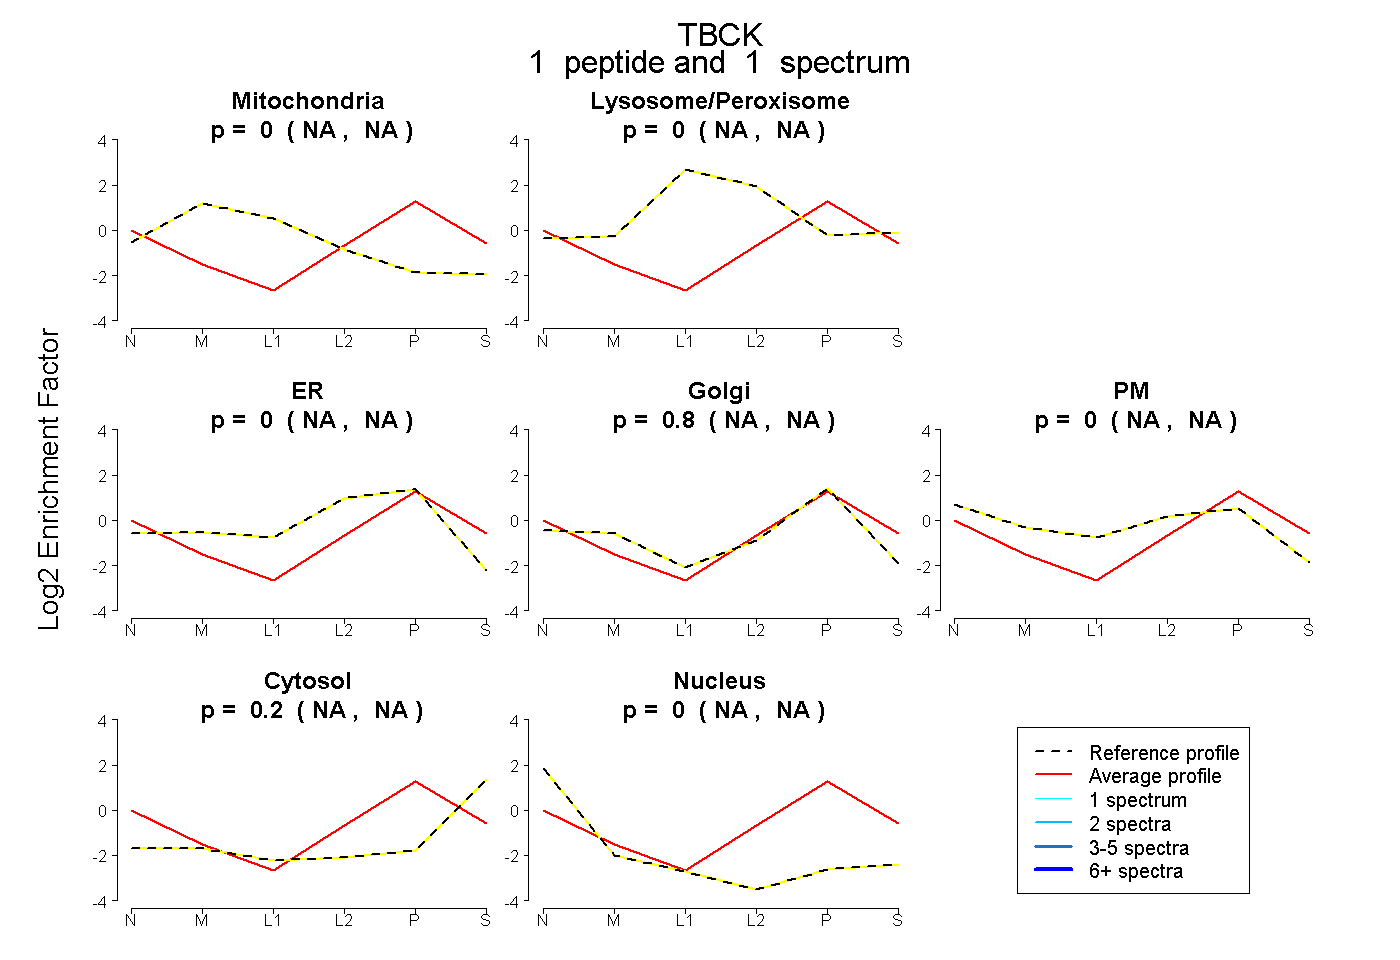 |
0.000
NA | NA |
|
0.000
NA | NA |
|
0.000
NA | NA |
0.796
NA | NA |
0.000
NA | NA |
0.204
NA | NA |
0.000
NA | NA |
|
| | | Plot |
|
Lyso |
|
|
|
|
|
|
|
Other |
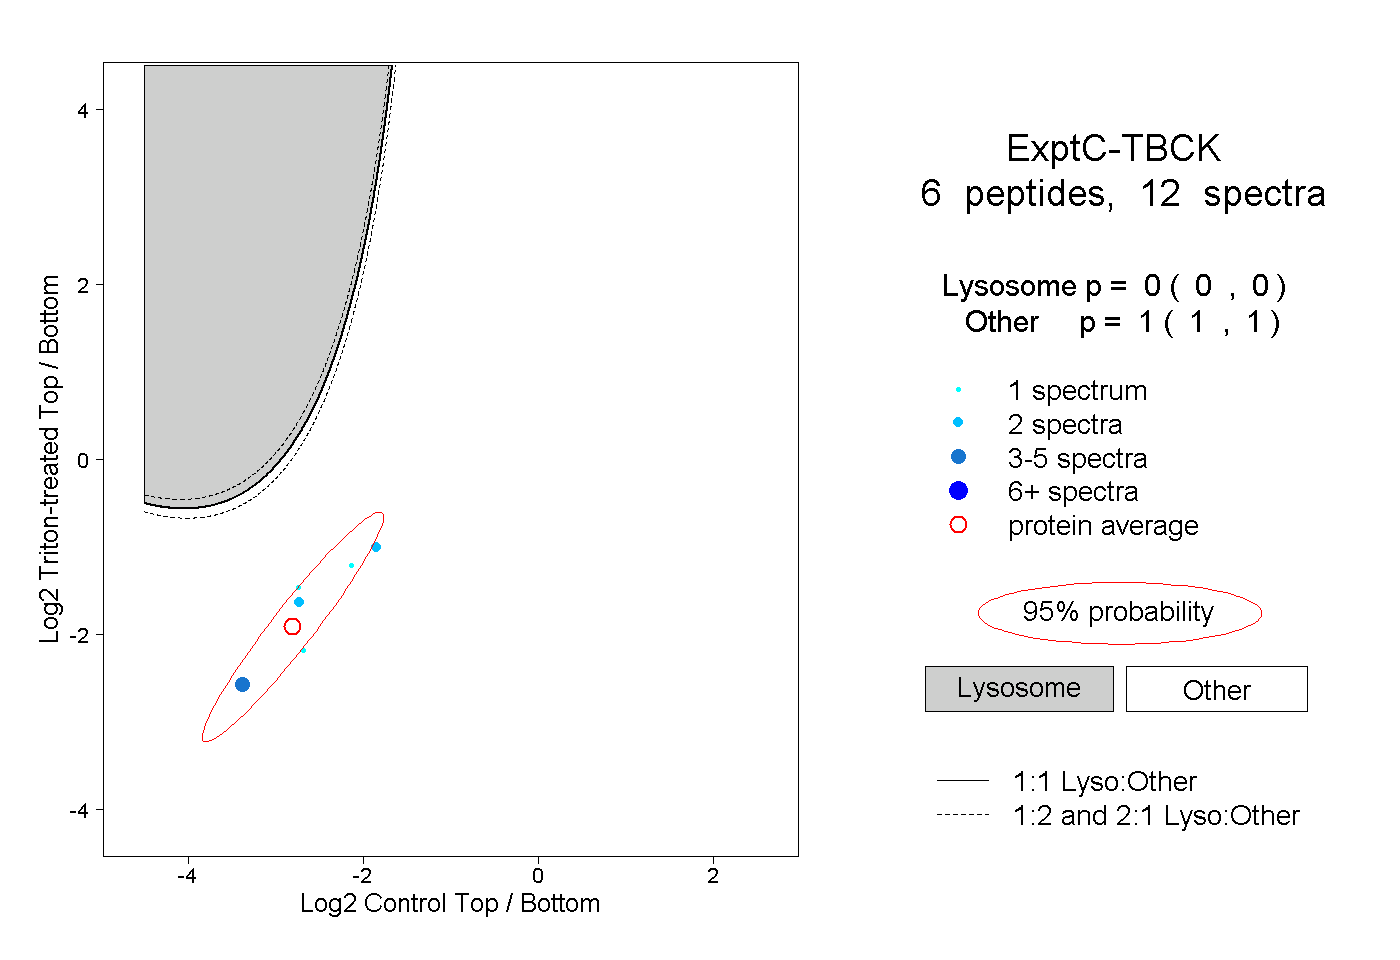
| Expt C |
6
peptides |
12
spectra |
 |
|
0.000
0.000 | 0.000 |
|
|
|
|
|
|
|
1.000
1.000 | 1.000 |
| 2 spectra, QIEVDIPR |
|
0.000 |
|
|
|
|
|
|
|
1.000 |
| 1 spectrum, AYPYK |
|
0.000 |
|
|
|
|
|
|
|
1.000 |
| 1 spectrum, SLEDLLR |
|
0.000 |
|
|
|
|
|
|
|
1.000 |
| 2 spectra, LVVVAEHCER |
|
0.000 |
|
|
|
|
|
|
|
1.000 |
| 1 spectrum, LLVVDIR |
|
0.000 |
|
|
|
|
|
|
|
1.000 |
| 5 spectra, LLLFDR |
|
0.000 |
|
|
|
|
|
|
|
1.000 |