 6
6peptides
spectra
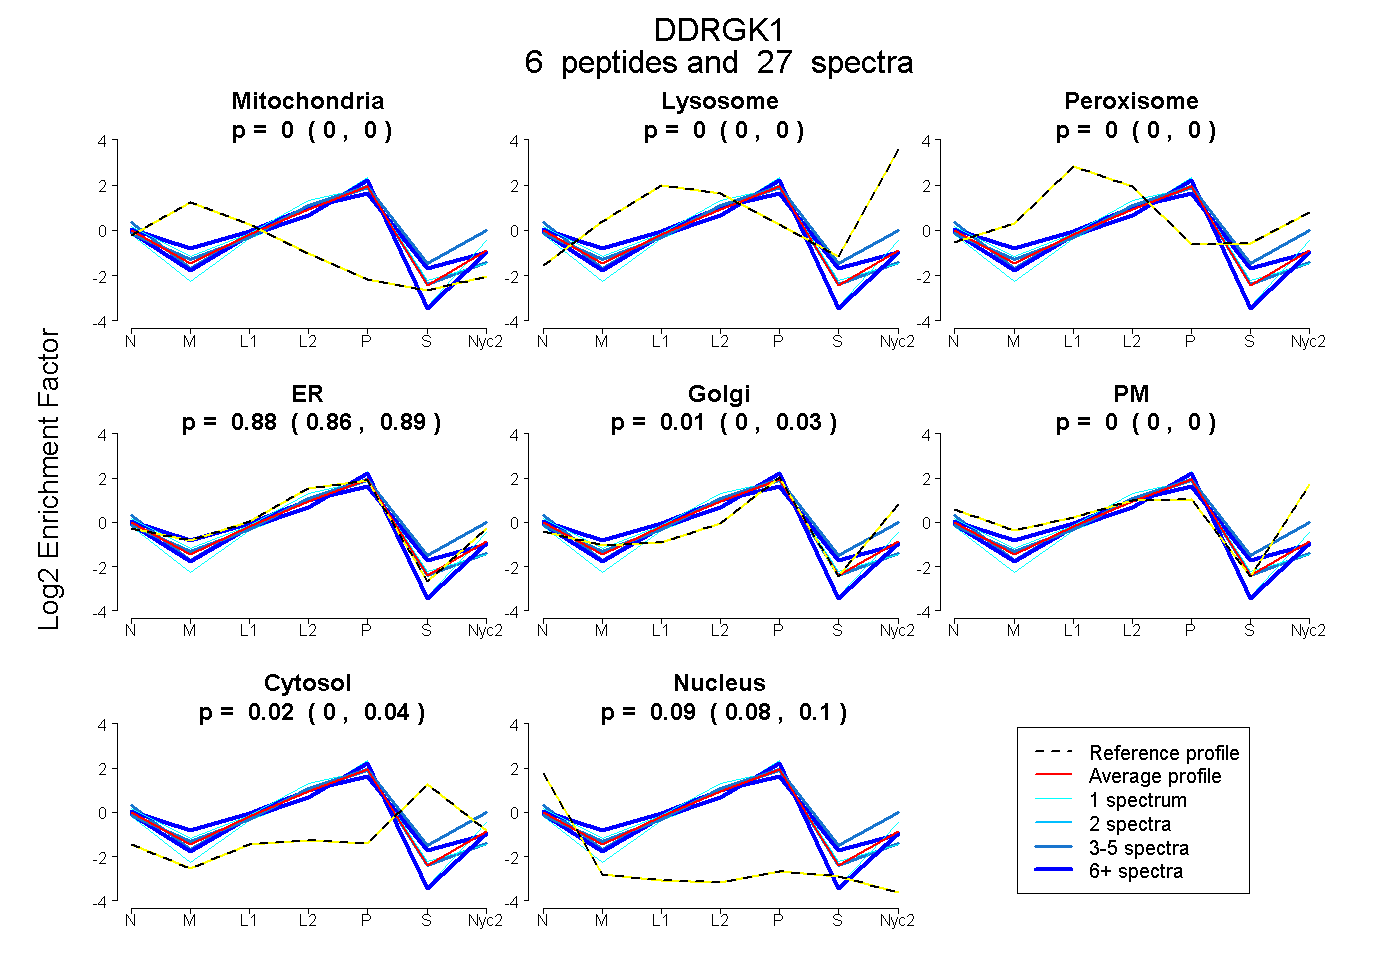
0.000 | 0.000
0.000 | 0.000
0.000 | 0.000
0.860 | 0.894
0.000 | 0.031
0.000 | 0.000
0.000 | 0.037
0.078 | 0.102
3peptides
spectra
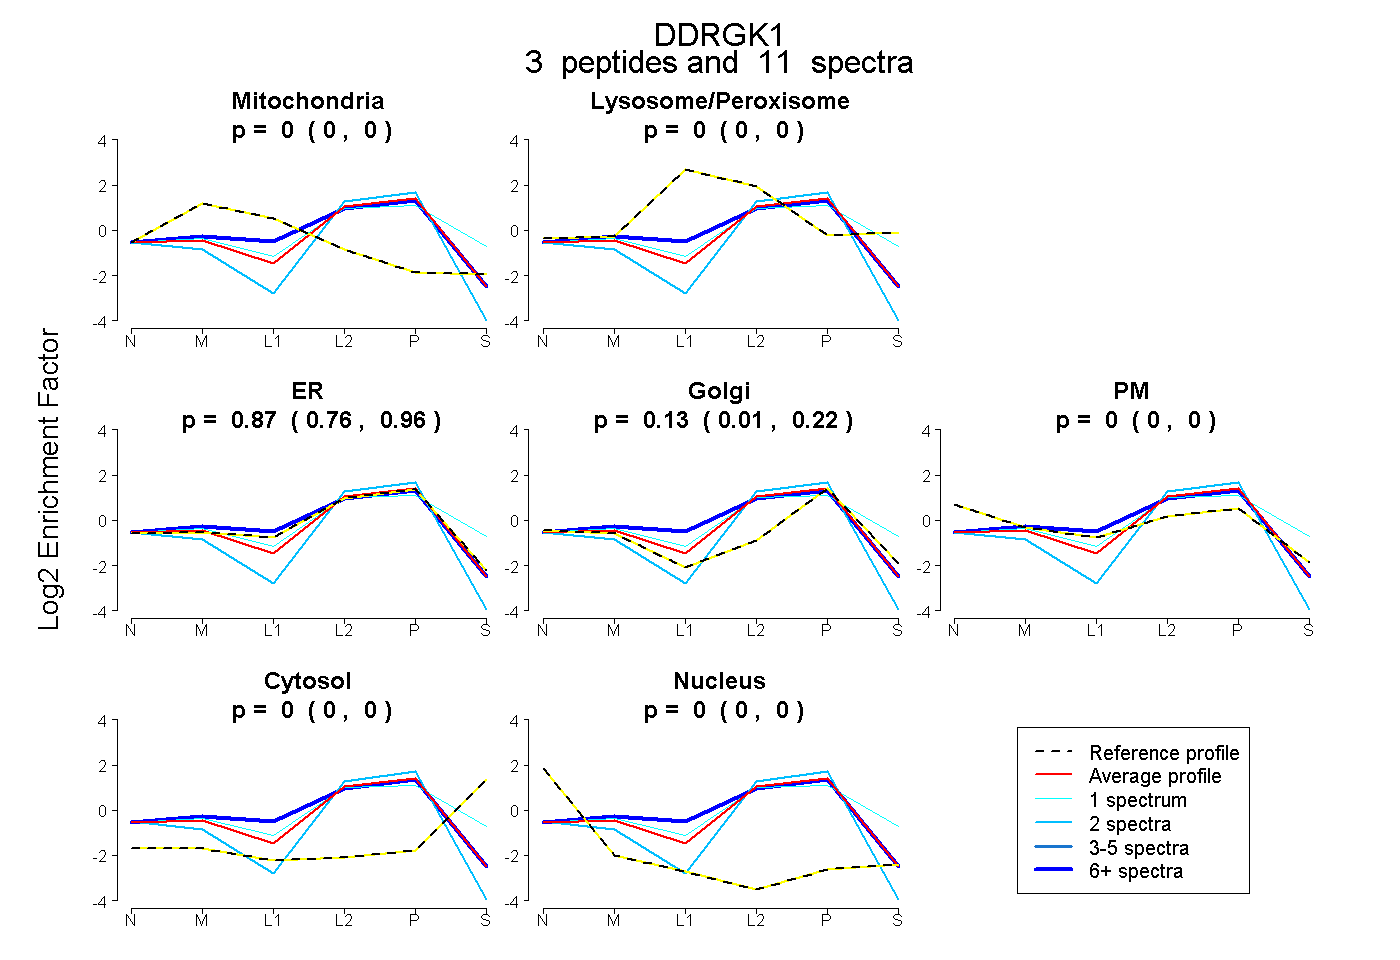
0.000 | 0.000
0.000 | 0.000
0.759 | 0.962
0.014 | 0.223
0.000 | 0.000
0.000 | 0.000
0.000 | 0.003
4peptides
spectra
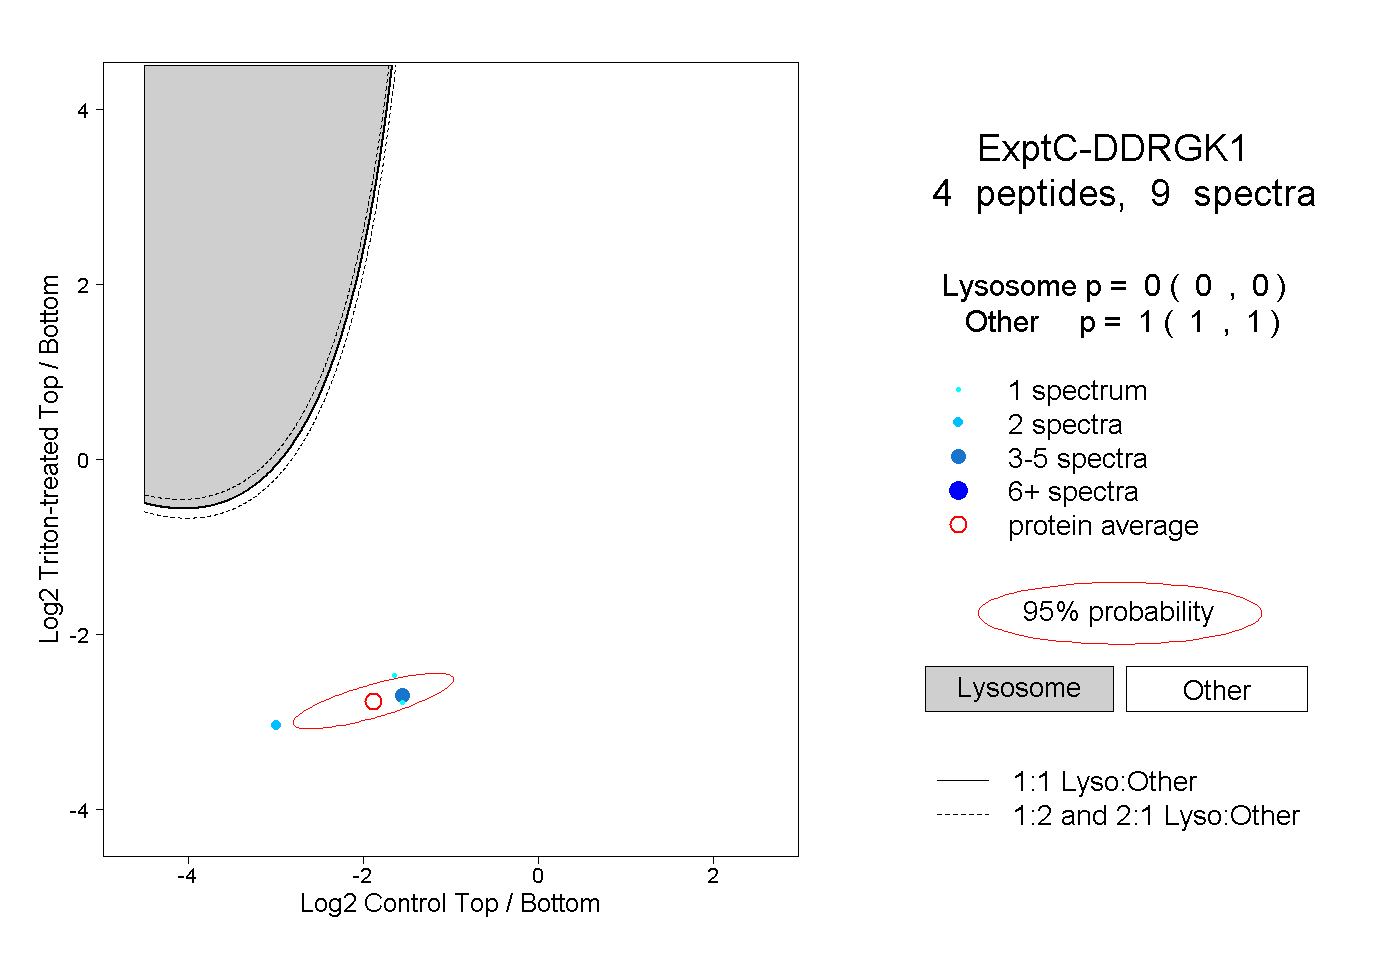
0.000 | 0.000
1.000 | 1.000
1peptide
spectra
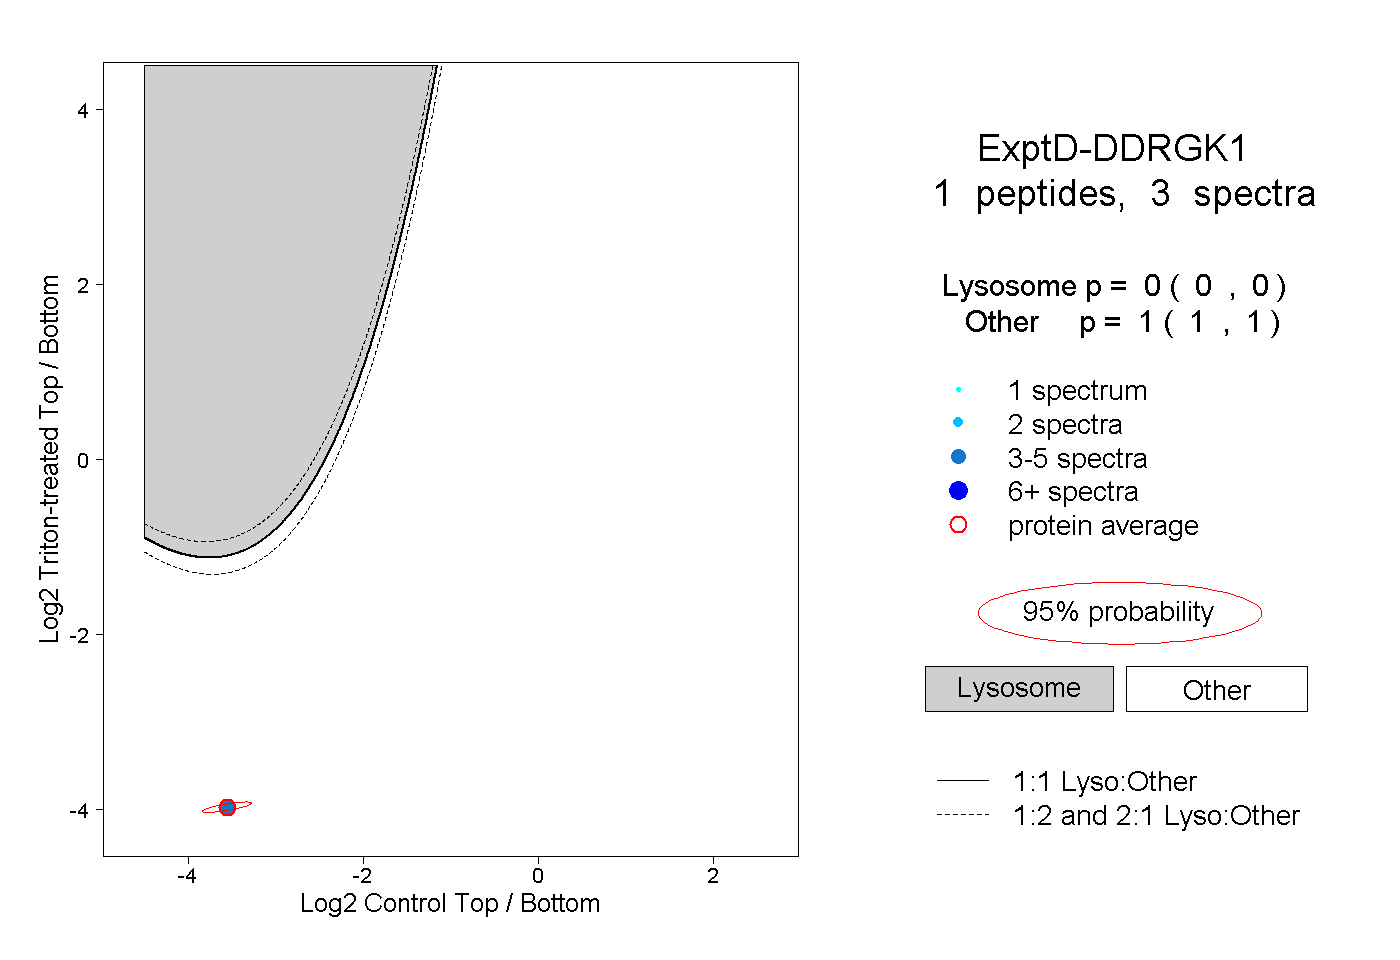
0.000 | 0.000
1.000 | 1.000