 6
6peptides
spectra
0.000 | 0.000
0.000 | 0.000
0.000 | 0.000
0.860 | 0.894
0.000 | 0.031
0.000 | 0.000
0.000 | 0.037
0.078 | 0.102
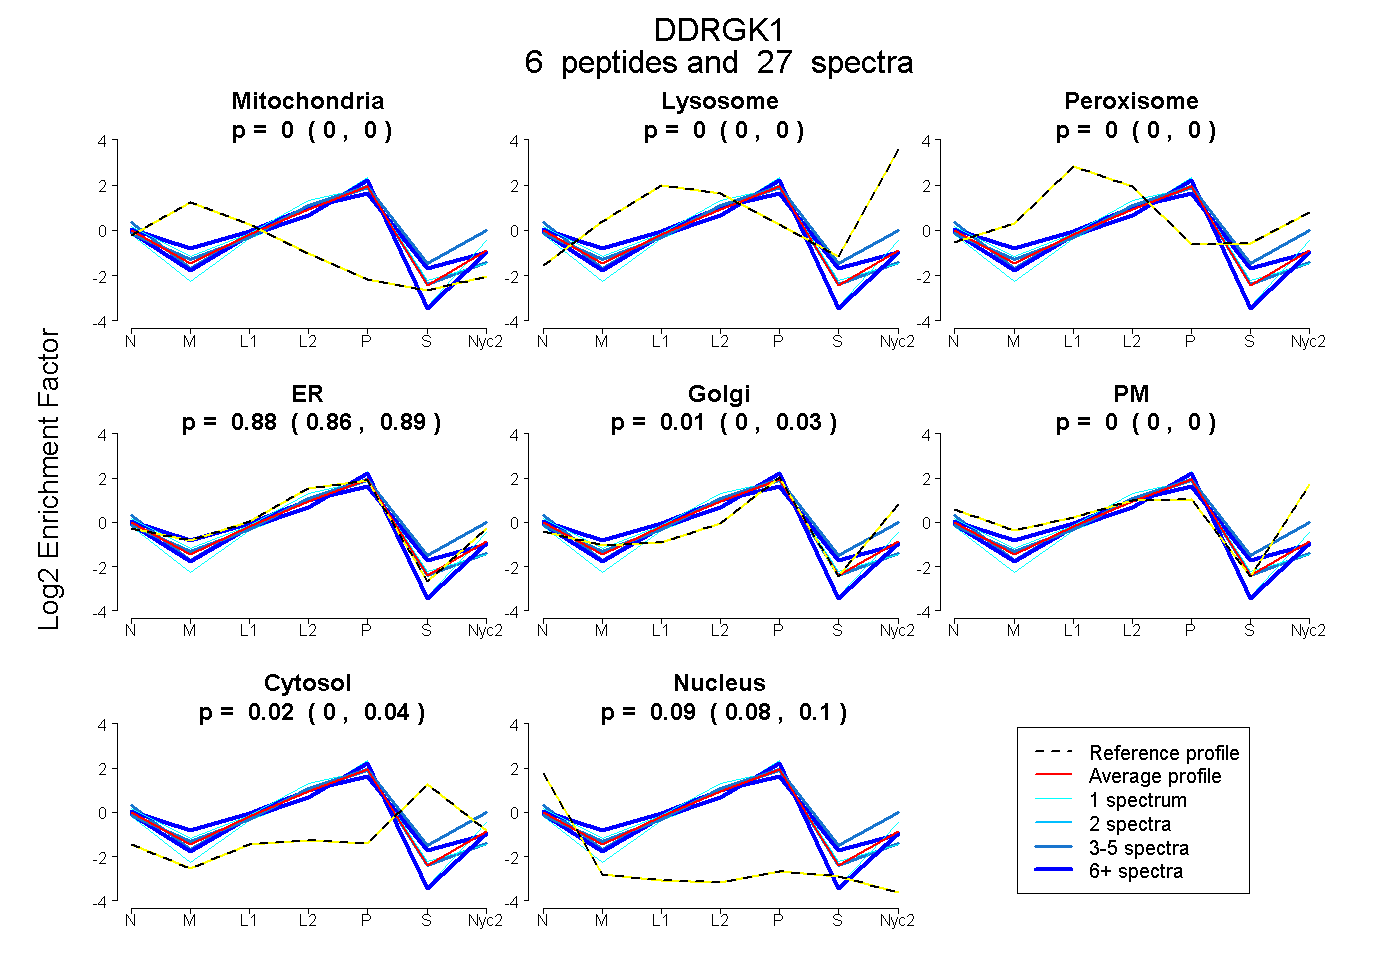
| Plot | Mito | Lyso | Perox | ER | Golgi | PM | Cytosol | Nucleus | |||||
| Expt A |
6 peptides |
27 spectra |
|
0.000 0.000 | 0.000 |
0.000 0.000 | 0.000 |
0.000 0.000 | 0.000 |
0.883 0.860 | 0.894 |
0.008 0.000 | 0.031 |
0.000 0.000 | 0.000 |
0.017 0.000 | 0.037 |
0.092 0.078 | 0.102 |
| 3 spectra, TQDAINR | 0.000 | 0.000 | 0.000 | 0.661 | 0.163 | 0.035 | 0.141 | 0.000 | ||
| 13 spectra, TGAGQVAR | 0.000 | 0.000 | 0.000 | 0.825 | 0.063 | 0.000 | 0.000 | 0.112 | ||
| 1 spectrum, IQDLLTEGTLTGVIDDR | 0.000 | 0.000 | 0.000 | 0.899 | 0.000 | 0.000 | 0.000 | 0.101 | ||
| 6 spectra, EHEEYLK | 0.015 | 0.000 | 0.021 | 0.812 | 0.000 | 0.000 | 0.114 | 0.037 | ||
| 1 spectrum, SWPQESEEQR | 0.000 | 0.000 | 0.000 | 0.648 | 0.277 | 0.000 | 0.000 | 0.076 | ||
| 3 spectra, AAAADGEPLHNEEER | 0.000 | 0.000 | 0.000 | 0.861 | 0.000 | 0.000 | 0.000 | 0.139 |
| Plot | Mito | Lyso or Perox | ER | Golgi | PM | Cytosol | Nucleus | ||||||
| Expt B |
3 peptides |
11 spectra |
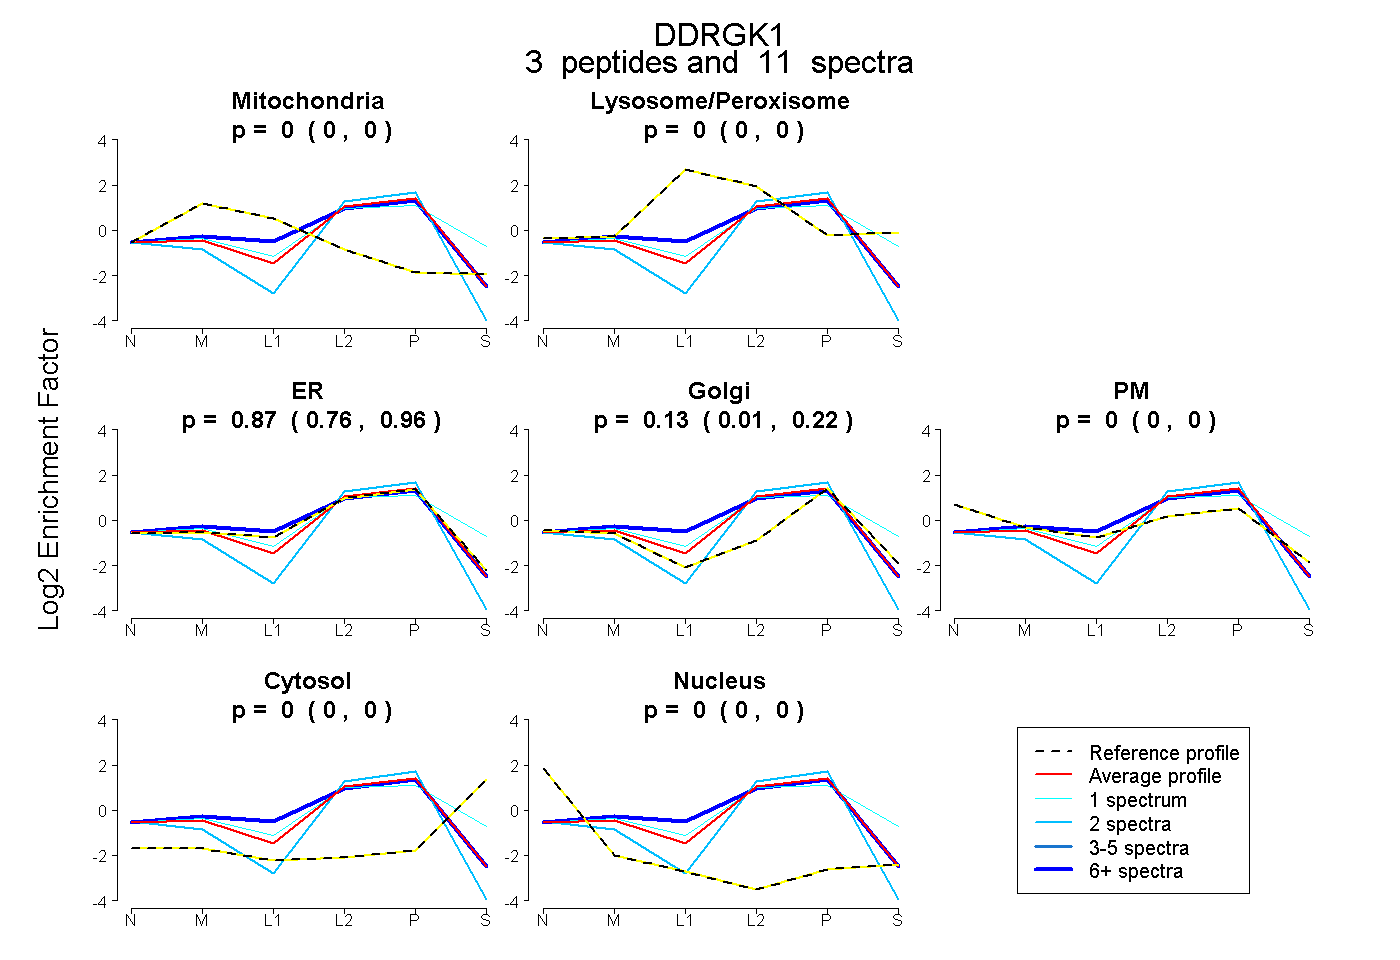 |
0.000 0.000 | 0.000 |
0.000 0.000 | 0.000 |
0.865 0.759 | 0.962 |
0.135 0.014 | 0.223 |
0.000 0.000 | 0.000 |
0.000 0.000 | 0.000 |
0.000 0.000 | 0.003 |
|||
| Plot | Lyso | Other | |||||||||||
| Expt C |
4 peptides |
9 spectra |
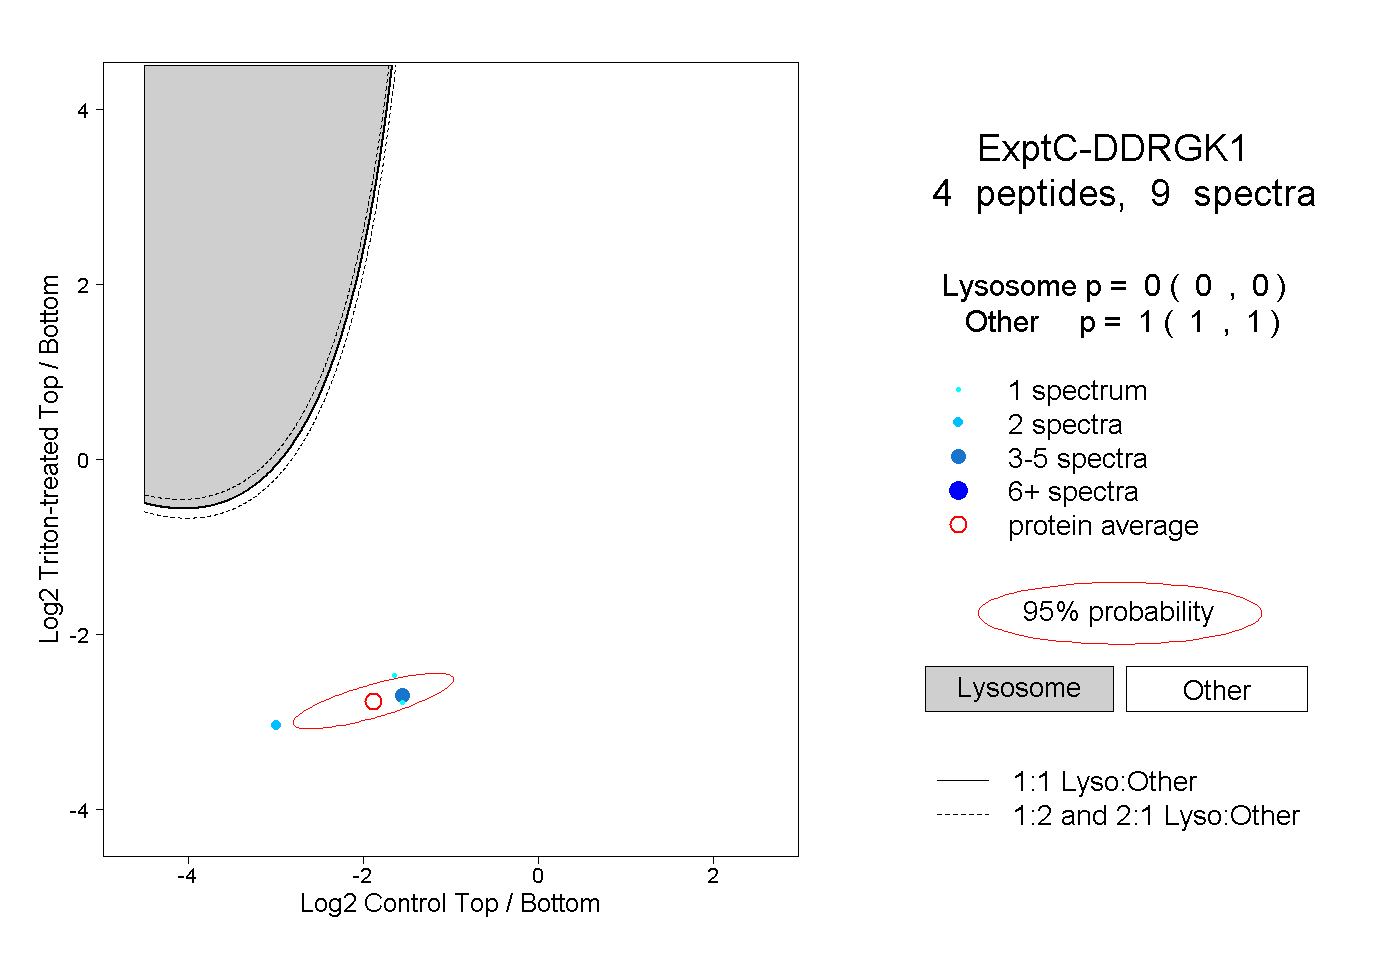 |
0.000 0.000 | 0.000 |
1.000 1.000 | 1.000 |
||||||||
| Plot | Lyso | Other | |||||||||||
| Expt D |
1 peptide |
3 spectra |
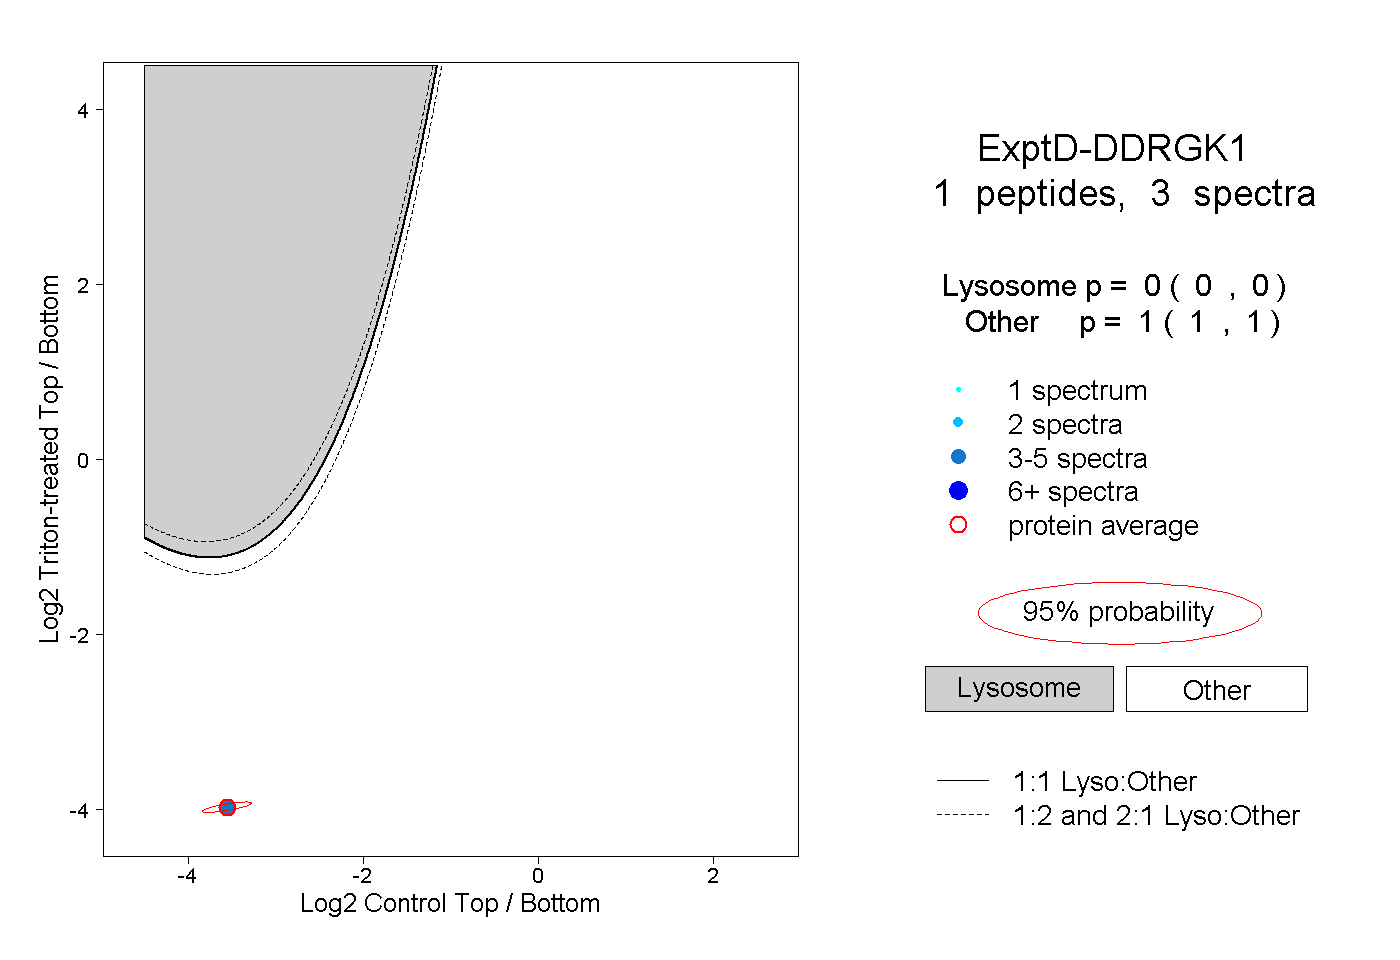 |
0.000 0.000 | 0.000 |
1.000 1.000 | 1.000 |