 7
7peptides
spectra
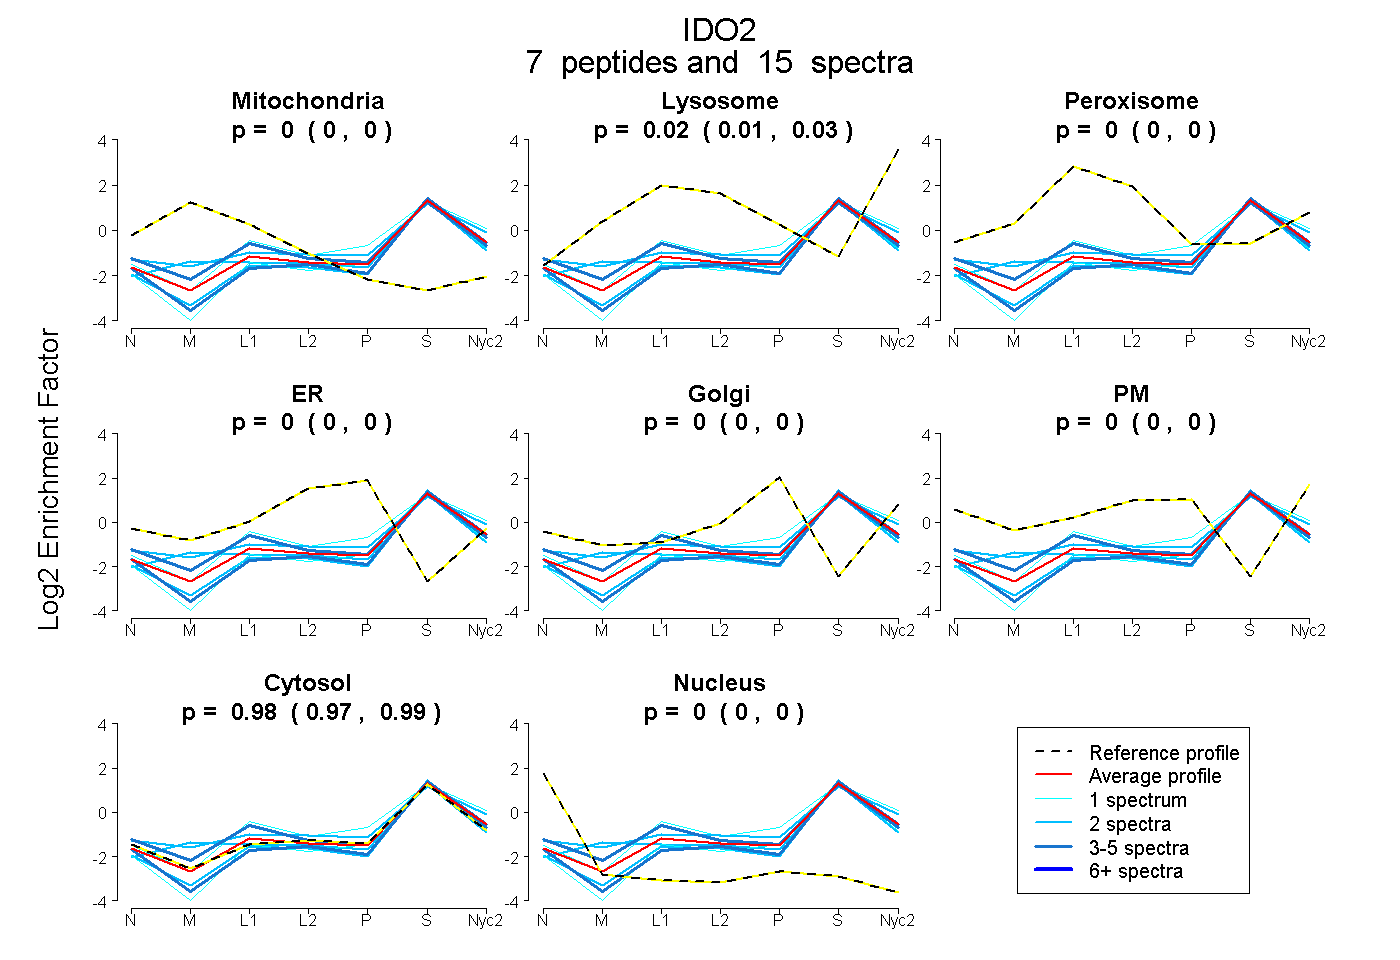
0.000 | 0.000
0.009 | 0.031
0.000 | 0.000
0.000 | 0.000
0.000 | 0.000
0.000 | 0.000
0.967 | 0.989
0.000 | 0.000
3peptides
spectra
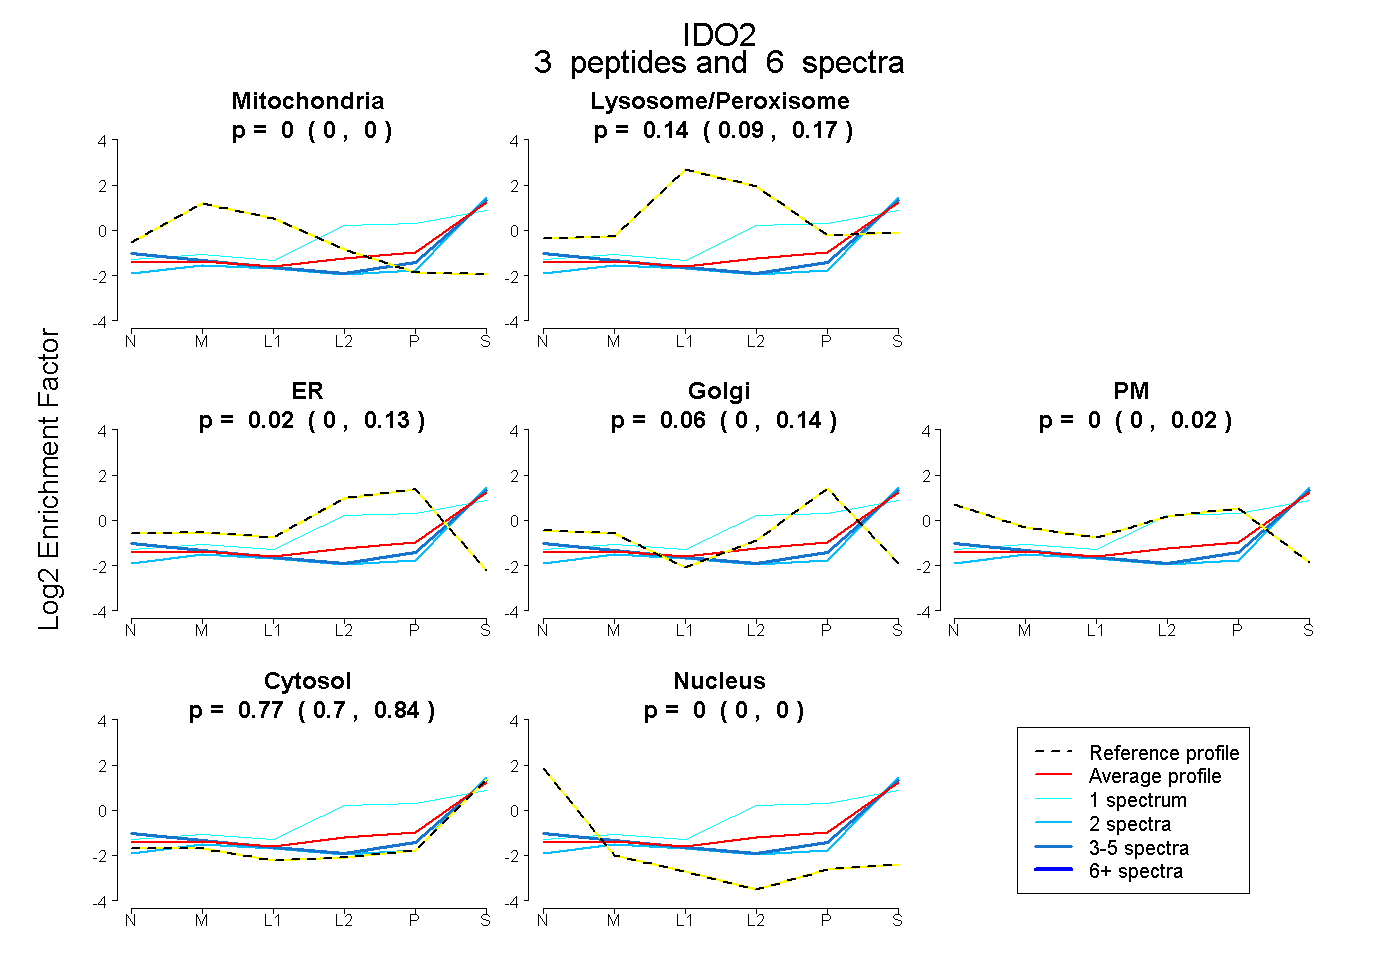
0.000 | 0.000
0.091 | 0.165
0.000 | 0.132
0.000 | 0.144
0.000 | 0.019
0.704 | 0.836
0.000 | 0.000
7peptides
spectra
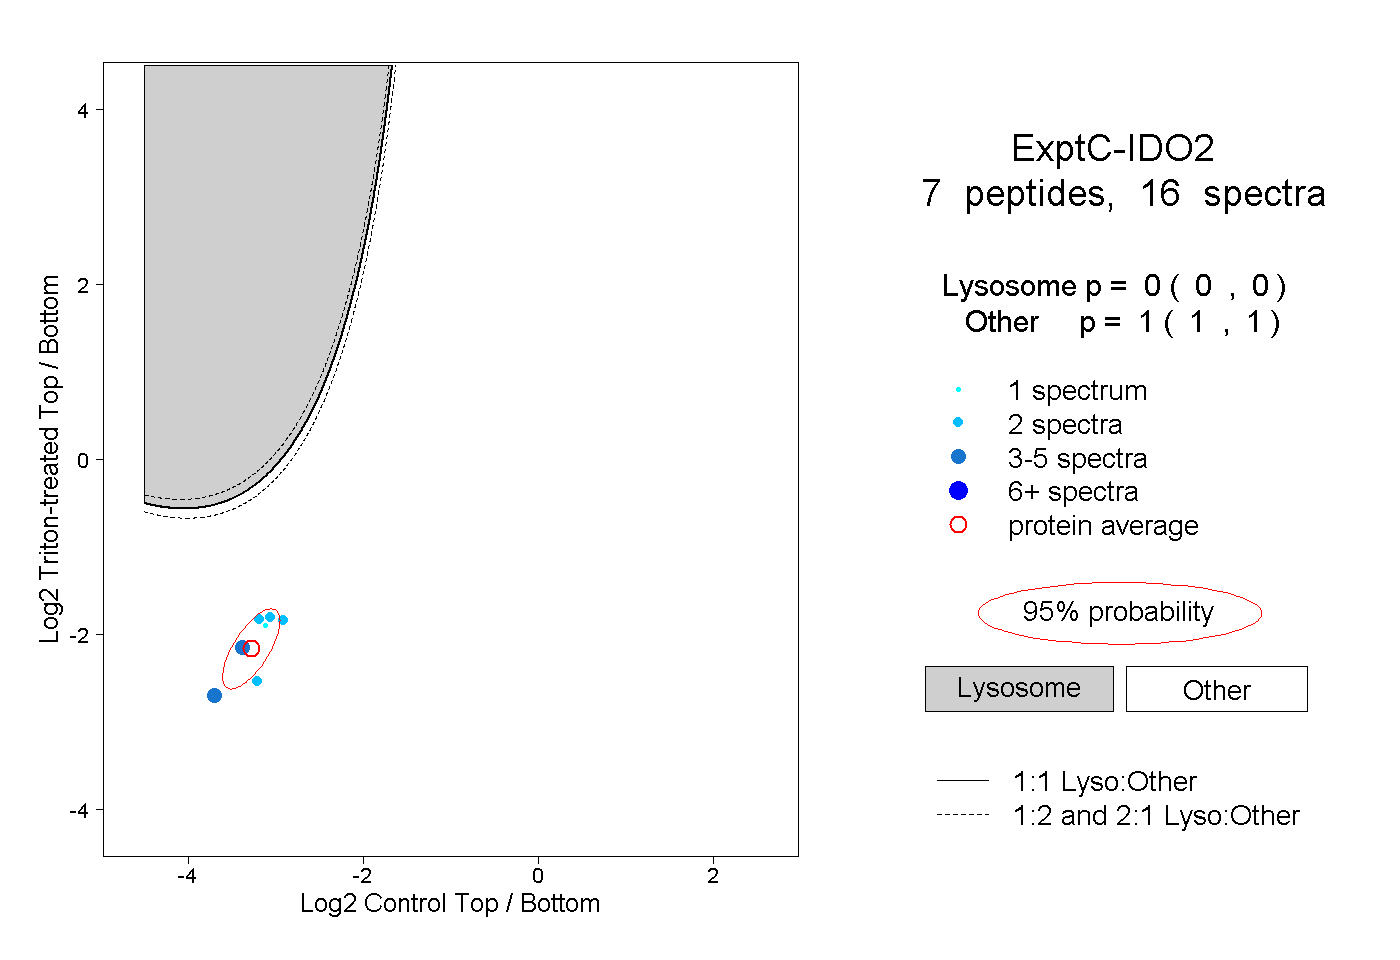
0.000 | 0.000
1.000 | 1.000