 7
7peptides
spectra
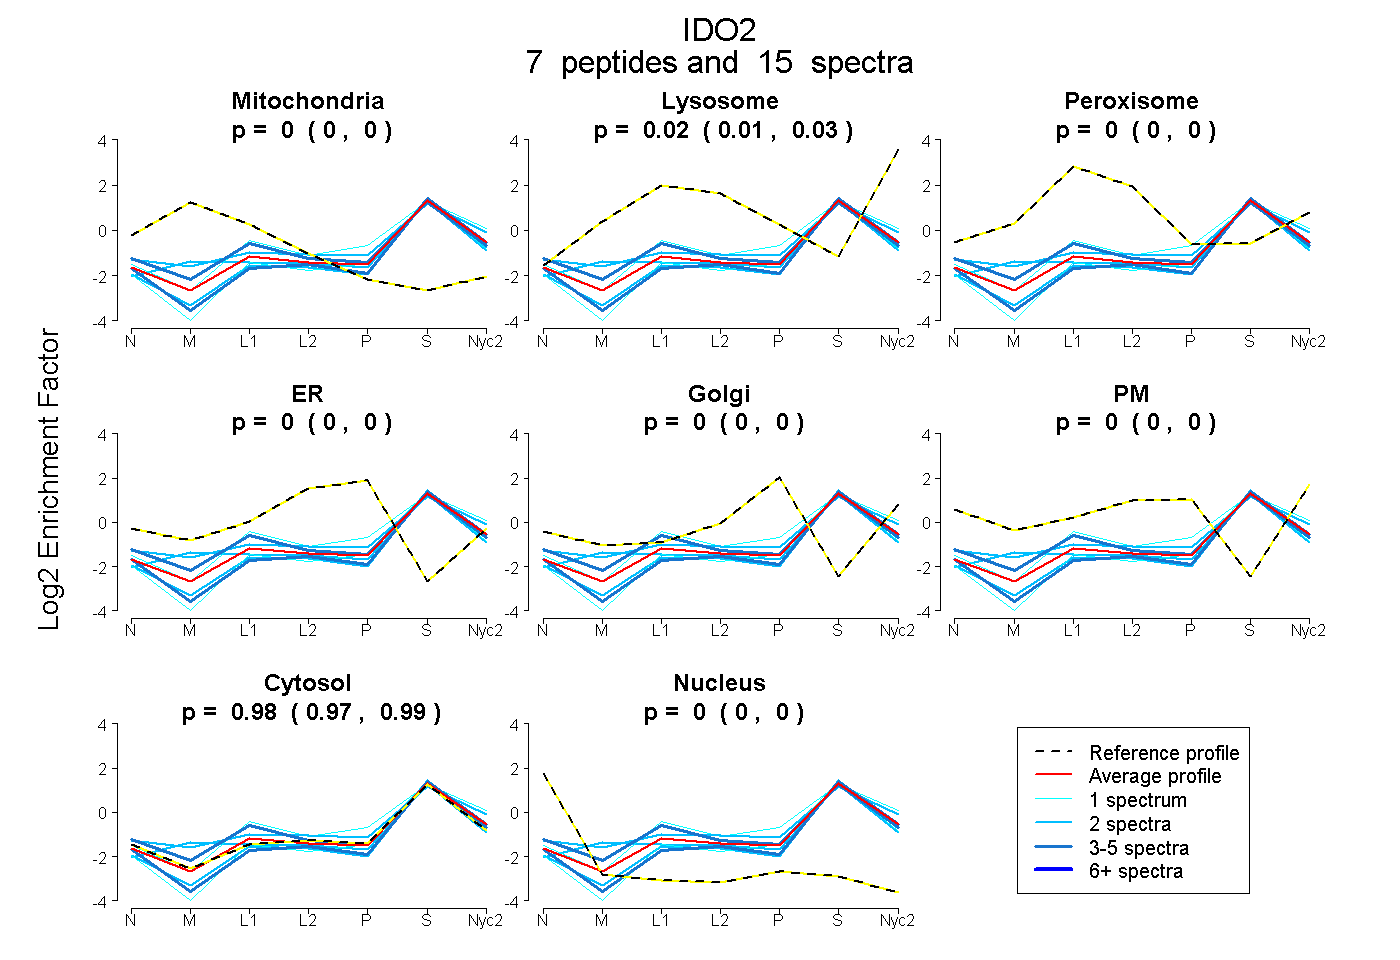
0.000 | 0.000
0.009 | 0.031
0.000 | 0.000
0.000 | 0.000
0.000 | 0.000
0.000 | 0.000
0.967 | 0.989
0.000 | 0.000
| Plot | Mito | Lyso | Perox | ER | Golgi | PM | Cytosol | Nucleus | |||||
| Expt A |
7 peptides |
15 spectra |
|
0.000 0.000 | 0.000 |
0.021 0.009 | 0.031 |
0.000 0.000 | 0.000 |
0.000 0.000 | 0.000 |
0.000 0.000 | 0.000 |
0.000 0.000 | 0.000 |
0.979 0.967 | 0.989 |
0.000 0.000 | 0.000 |
| 4 spectra, LSIQDITR | 0.001 | 0.000 | 0.116 | 0.000 | 0.000 | 0.000 | 0.883 | 0.000 | ||
| 2 spectra, FLTSYR | 0.023 | 0.146 | 0.000 | 0.000 | 0.000 | 0.000 | 0.832 | 0.000 | ||
| 2 spectra, AFLEDLHSAPSLR | 0.108 | 0.000 | 0.000 | 0.000 | 0.000 | 0.000 | 0.892 | 0.000 | ||
| 1 spectrum, ALAQMHDYVDPEIFYLVIR | 0.000 | 0.156 | 0.000 | 0.000 | 0.000 | 0.000 | 0.844 | 0.000 | ||
| 3 spectra, IFLSGWK | 0.000 | 0.000 | 0.000 | 0.000 | 0.000 | 0.000 | 1.000 | 0.000 | ||
| 2 spectra, ALVLGVEAIR | 0.000 | 0.000 | 0.000 | 0.000 | 0.000 | 0.000 | 1.000 | 0.000 | ||
| 1 spectrum, GTGGTAVLSFLK | 0.000 | 0.000 | 0.000 | 0.000 | 0.000 | 0.000 | 1.000 | 0.000 |
| Plot | Mito | Lyso or Perox | ER | Golgi | PM | Cytosol | Nucleus | ||||||
| Expt B |
3 peptides |
6 spectra |
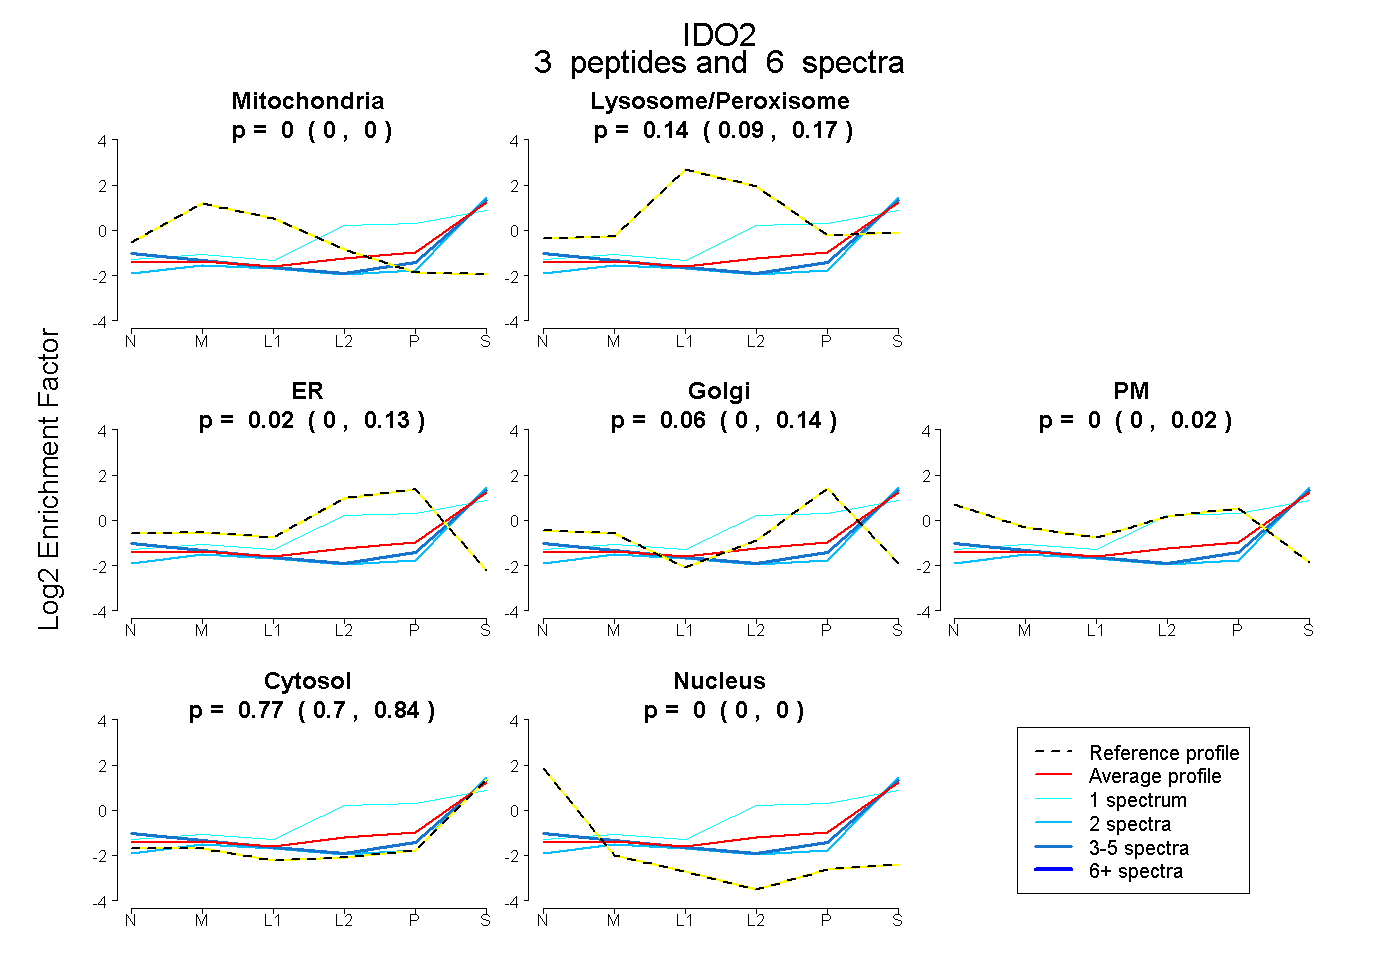 |
0.000 0.000 | 0.000 |
0.142 0.091 | 0.165 |
0.021 0.000 | 0.132 |
0.065 0.000 | 0.144 |
0.000 0.000 | 0.019 |
0.772 0.704 | 0.836 |
0.000 0.000 | 0.000 |
|||
| Plot | Lyso | Other | |||||||||||
| Expt C |
7 peptides |
16 spectra |
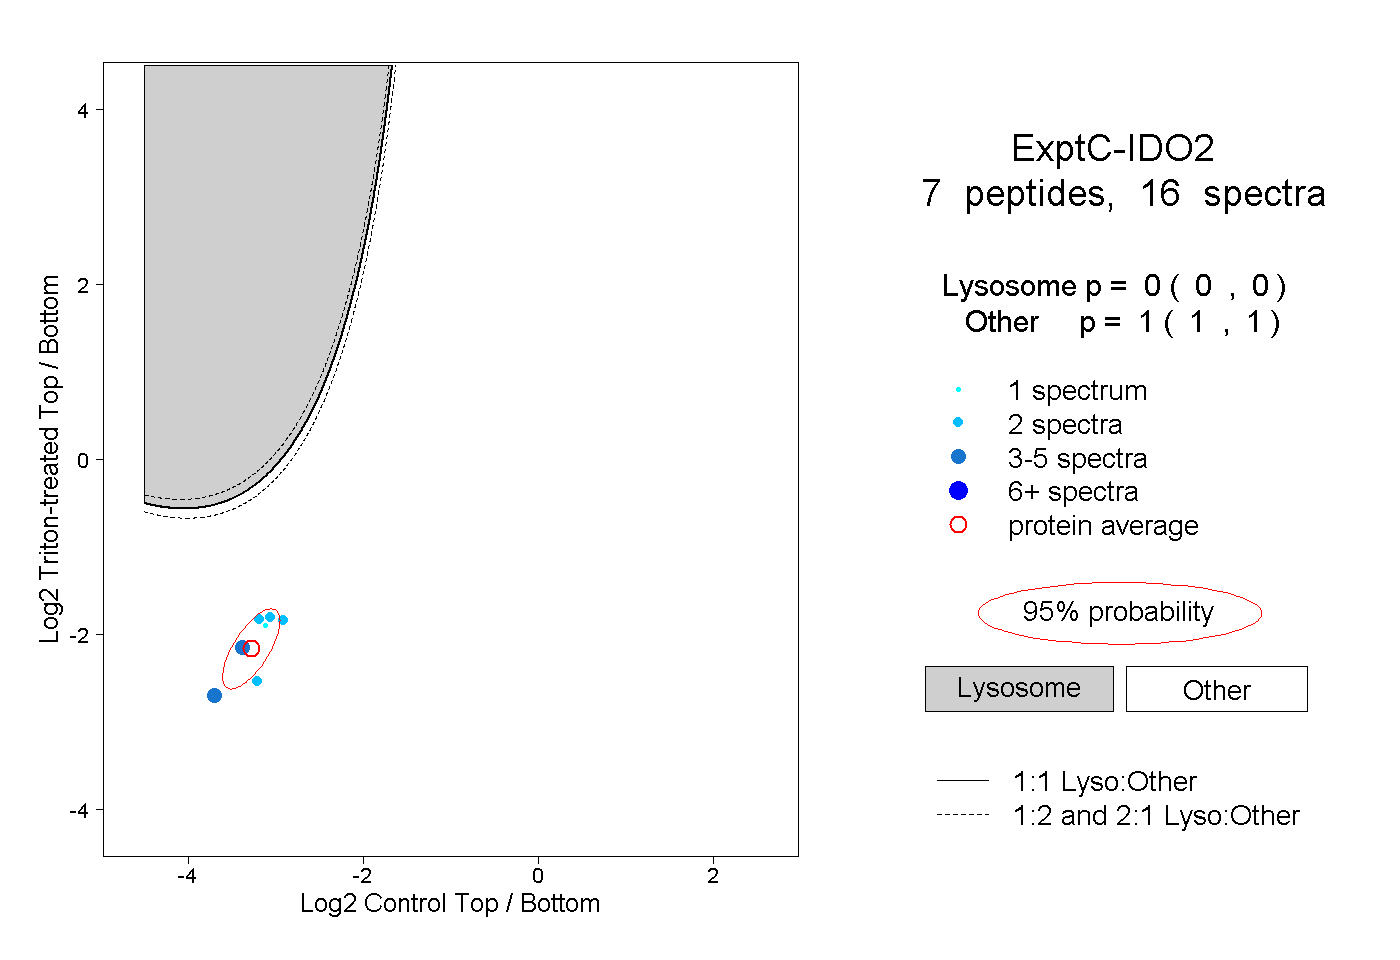 |
0.000 0.000 | 0.000 |
1.000 1.000 | 1.000 |