 9
9peptides
spectra

0.000 | 0.000
0.000 | 0.000
0.131 | 0.184
0.608 | 0.716
0.000 | 0.000
0.000 | 0.099
0.083 | 0.147
0.000 | 0.035
4peptides
spectra
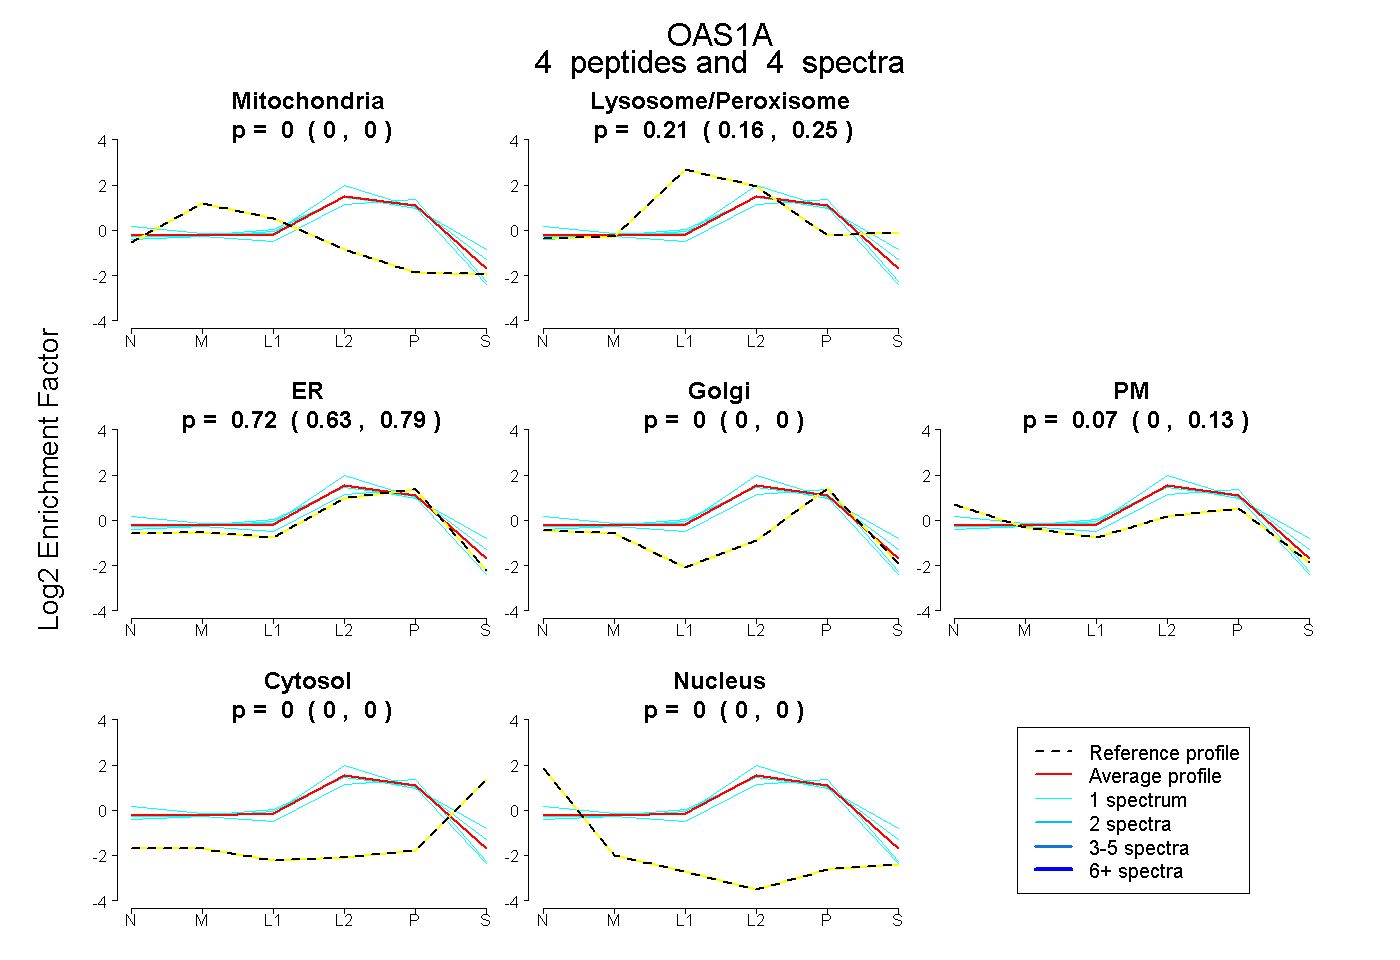
0.000 | 0.000
0.165 | 0.250
0.635 | 0.790
0.000 | 0.000
0.000 | 0.128
0.000 | 0.000
0.000 | 0.000
7peptides
spectra
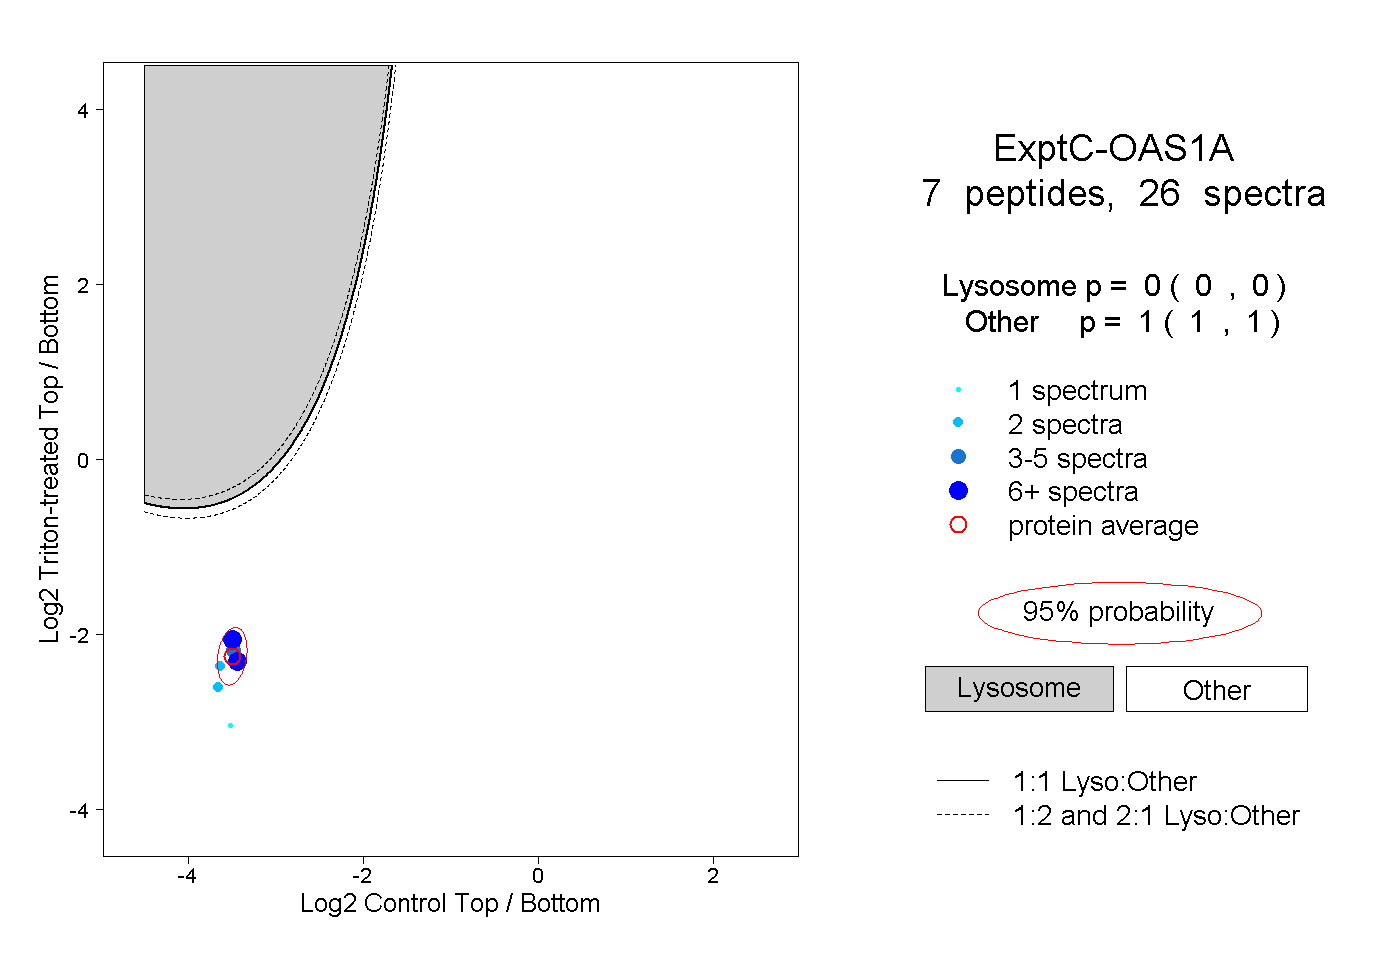
0.000 | 0.000
1.000 | 1.000
3peptides
spectra
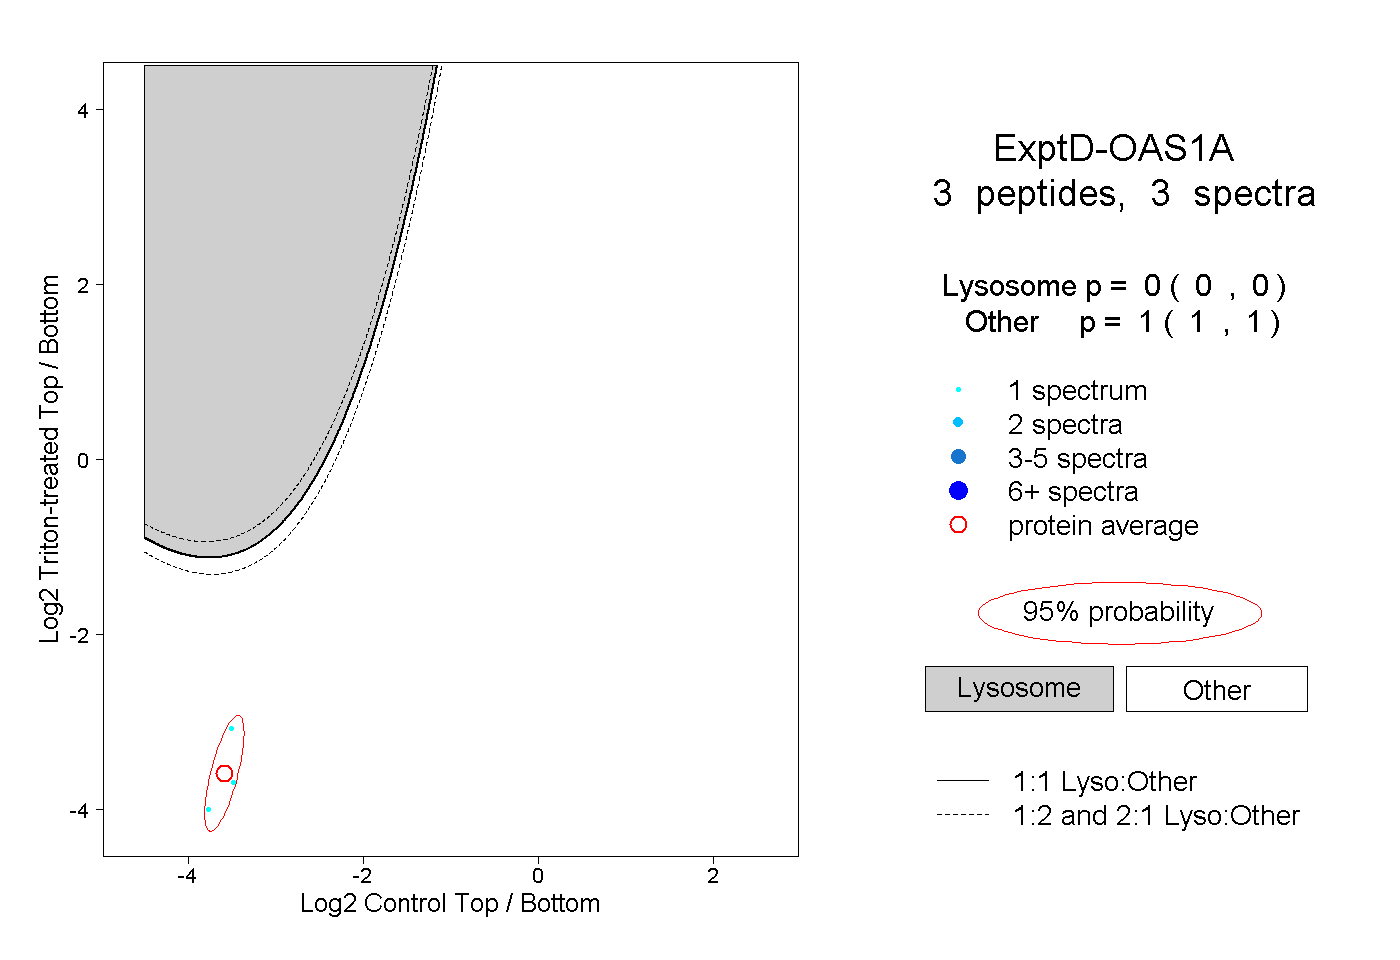
0.000 | 0.000
1.000 | 1.000