 9
9peptides
spectra

0.000 | 0.000
0.000 | 0.000
0.131 | 0.184
0.608 | 0.716
0.000 | 0.000
0.000 | 0.099
0.083 | 0.147
0.000 | 0.035
| Plot | Mito | Lyso | Perox | ER | Golgi | PM | Cytosol | Nucleus | |||||
| Expt A |
9 peptides |
13 spectra |
|
0.000 0.000 | 0.000 |
0.000 0.000 | 0.000 |
0.166 0.131 | 0.184 |
0.696 0.608 | 0.716 |
0.000 0.000 | 0.000 |
0.003 0.000 | 0.099 |
0.122 0.083 | 0.147 |
0.013 0.000 | 0.035 |
| 1 spectrum, LASEAR | 0.000 | 0.000 | 0.083 | 0.404 | 0.000 | 0.375 | 0.121 | 0.017 | ||
| 1 spectrum, EQELR | 0.000 | 0.000 | 0.000 | 0.081 | 0.092 | 0.193 | 0.482 | 0.152 | ||
| 2 spectra, EGEFSTCFTELQR | 0.341 | 0.000 | 0.000 | 0.655 | 0.000 | 0.000 | 0.000 | 0.004 | ||
| 1 spectrum, HWYQLCK | 0.000 | 0.000 | 0.170 | 0.456 | 0.000 | 0.000 | 0.375 | 0.000 | ||
| 2 spectra, DTVHPVR | 0.000 | 0.066 | 0.204 | 0.610 | 0.000 | 0.001 | 0.120 | 0.000 | ||
| 2 spectra, TILELVTK | 0.000 | 0.188 | 0.068 | 0.555 | 0.000 | 0.121 | 0.067 | 0.000 | ||
| 1 spectrum, SAINVLCDFLK | 0.272 | 0.000 | 0.000 | 0.607 | 0.000 | 0.000 | 0.072 | 0.049 | ||
| 2 spectra, STPSWK | 0.000 | 0.096 | 0.064 | 0.574 | 0.000 | 0.265 | 0.000 | 0.000 | ||
| 1 spectrum, GNGLTEFNTAQGFR | 0.000 | 0.153 | 0.043 | 0.629 | 0.000 | 0.175 | 0.000 | 0.000 |
| Plot | Mito | Lyso or Perox | ER | Golgi | PM | Cytosol | Nucleus | ||||||
| Expt B |
4 peptides |
4 spectra |
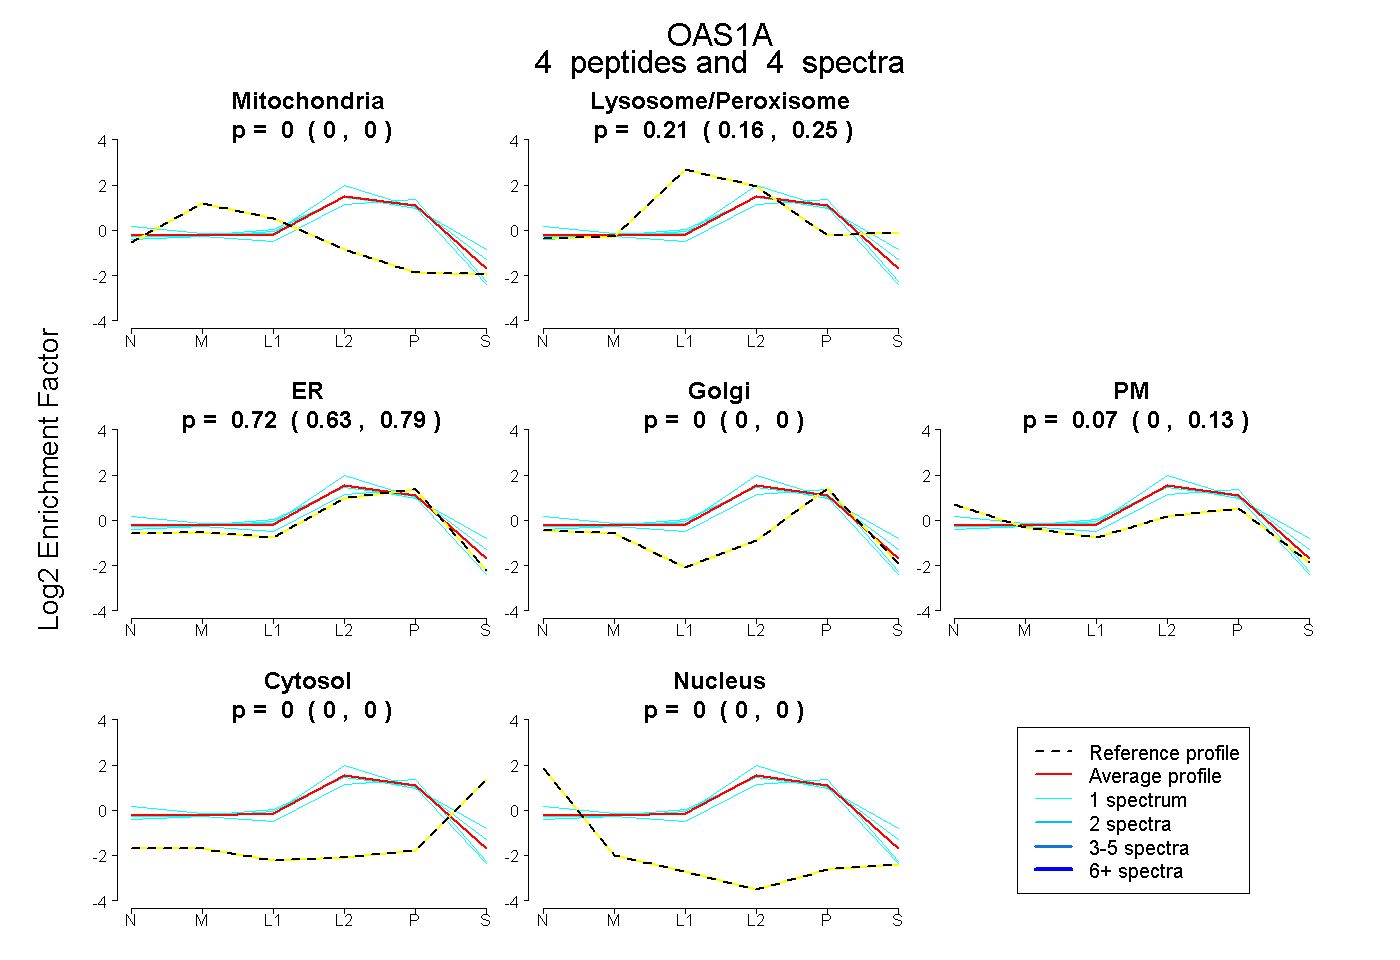 |
0.000 0.000 | 0.000 |
0.210 0.165 | 0.250 |
0.722 0.635 | 0.790 |
0.000 0.000 | 0.000 |
0.068 0.000 | 0.128 |
0.000 0.000 | 0.000 |
0.000 0.000 | 0.000 |
|||
| Plot | Lyso | Other | |||||||||||
| Expt C |
7 peptides |
26 spectra |
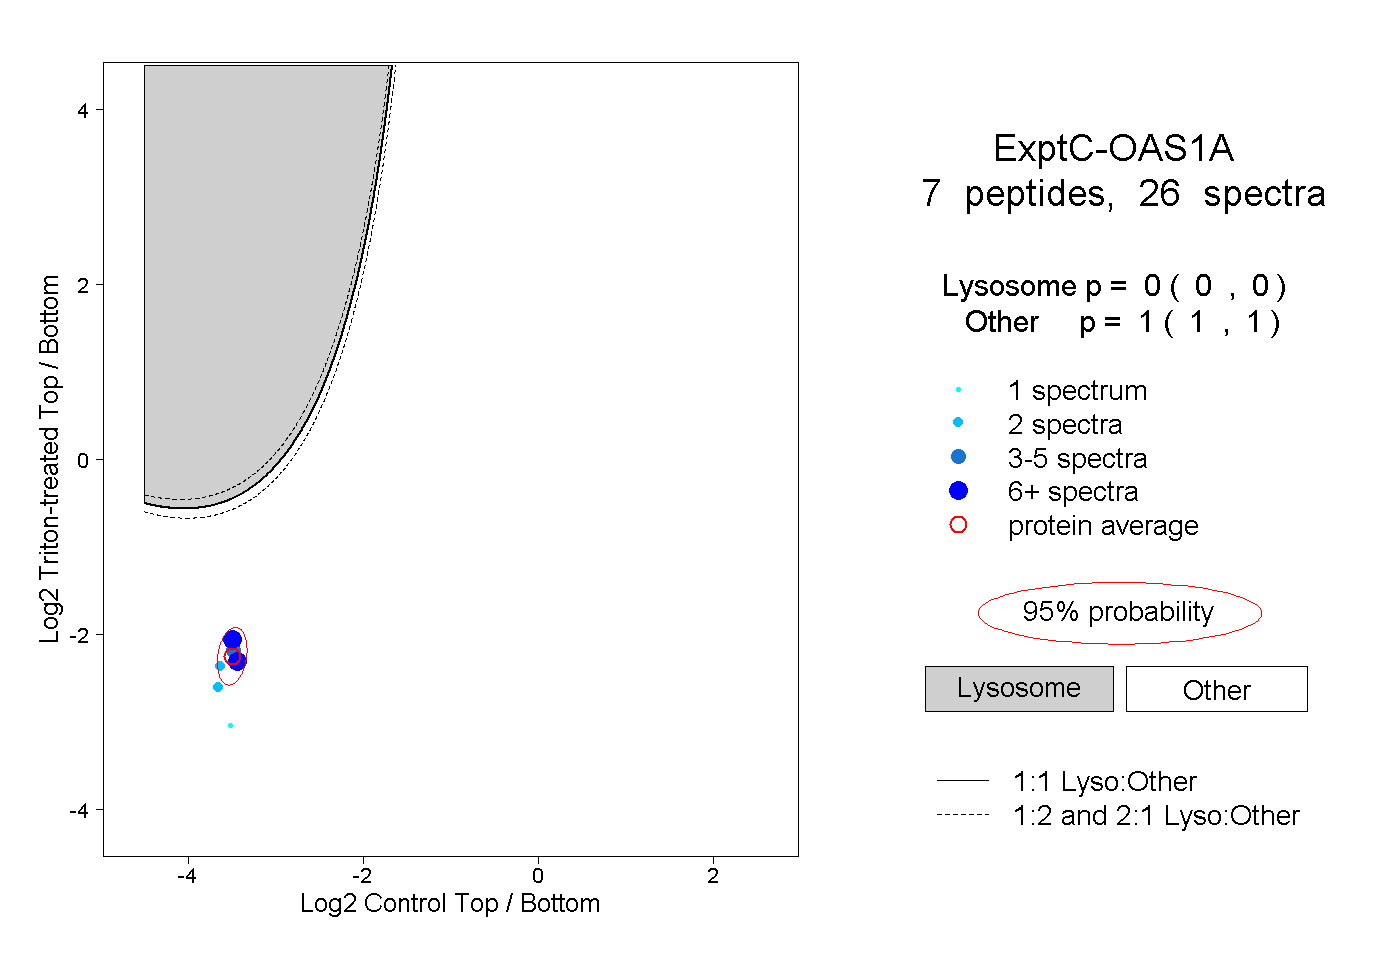 |
0.000 0.000 | 0.000 |
1.000 1.000 | 1.000 |
||||||||
| Plot | Lyso | Other | |||||||||||
| Expt D |
3 peptides |
3 spectra |
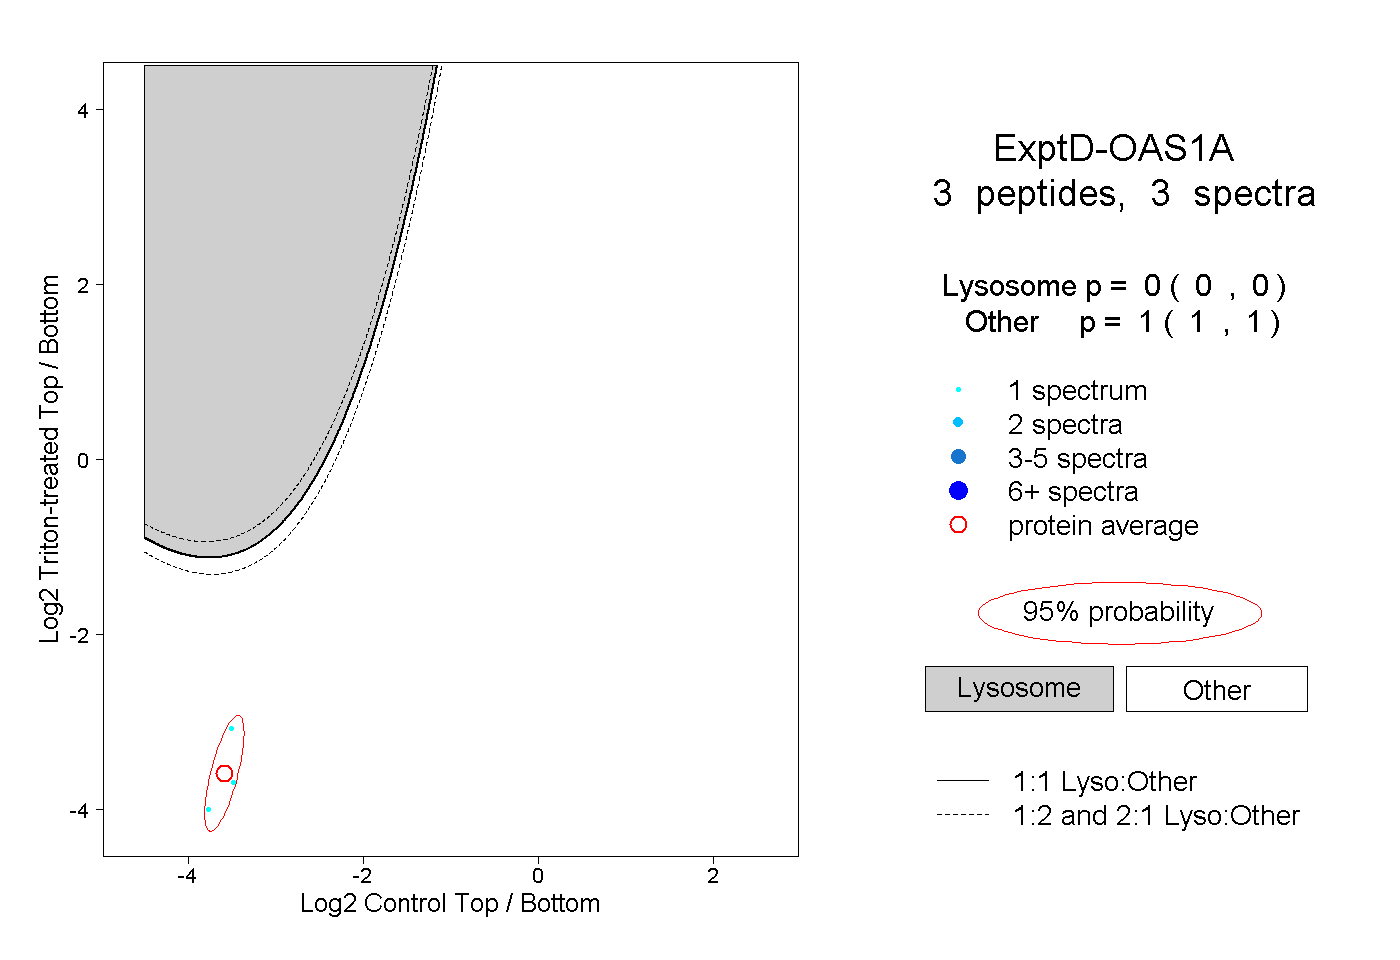 |
0.000 0.000 | 0.000 |
1.000 1.000 | 1.000 |