 17
17peptides
spectra
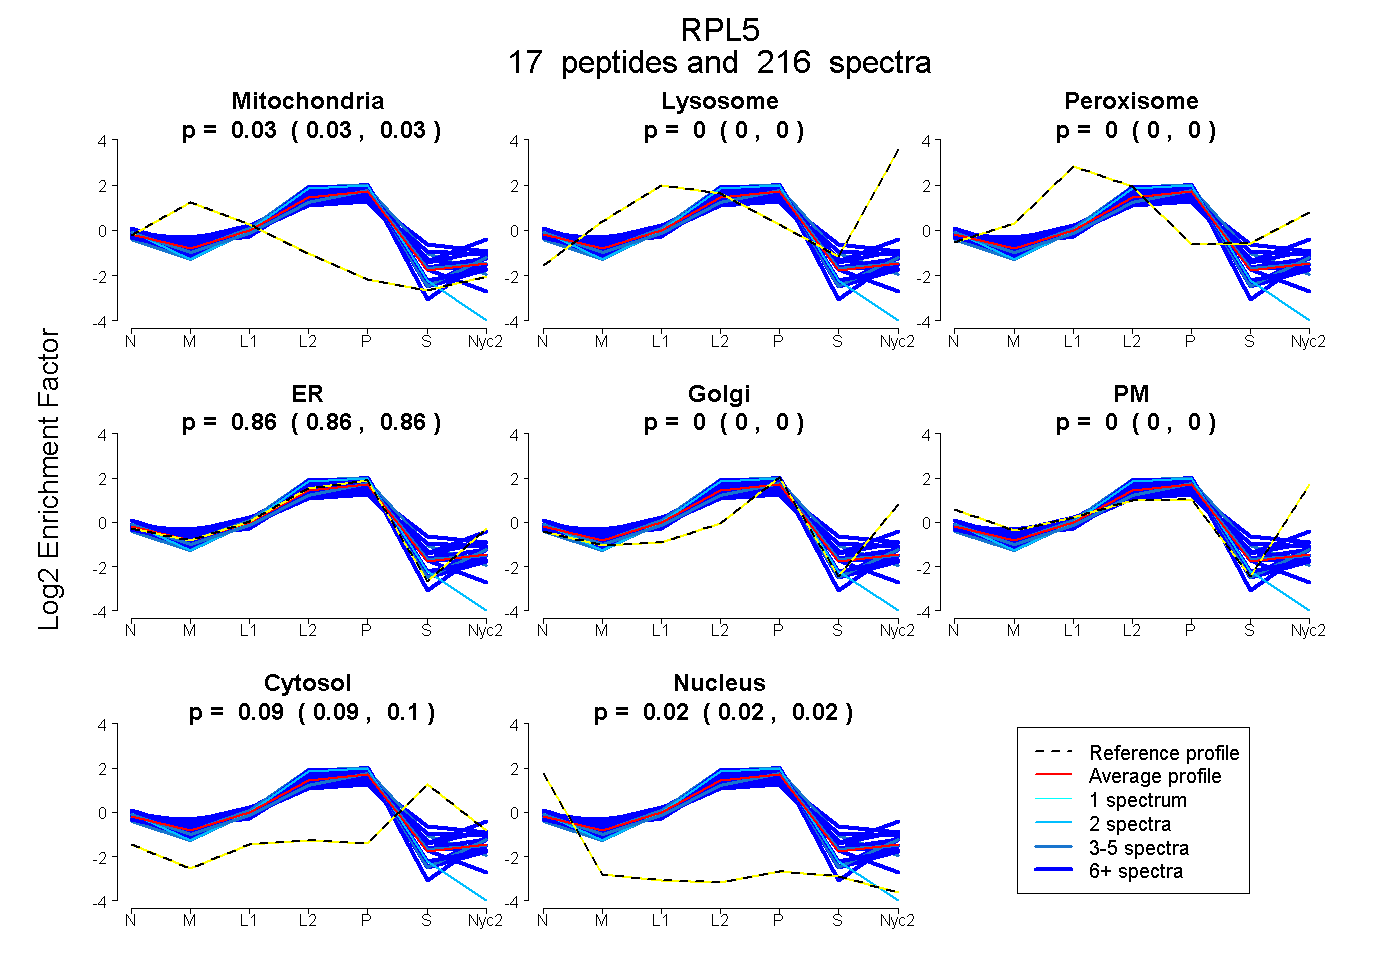
0.026 | 0.029
0.000 | 0.000
0.000 | 0.000
0.856 | 0.860
0.000 | 0.000
0.000 | 0.000
0.091 | 0.098
0.017 | 0.021
14peptides
spectra
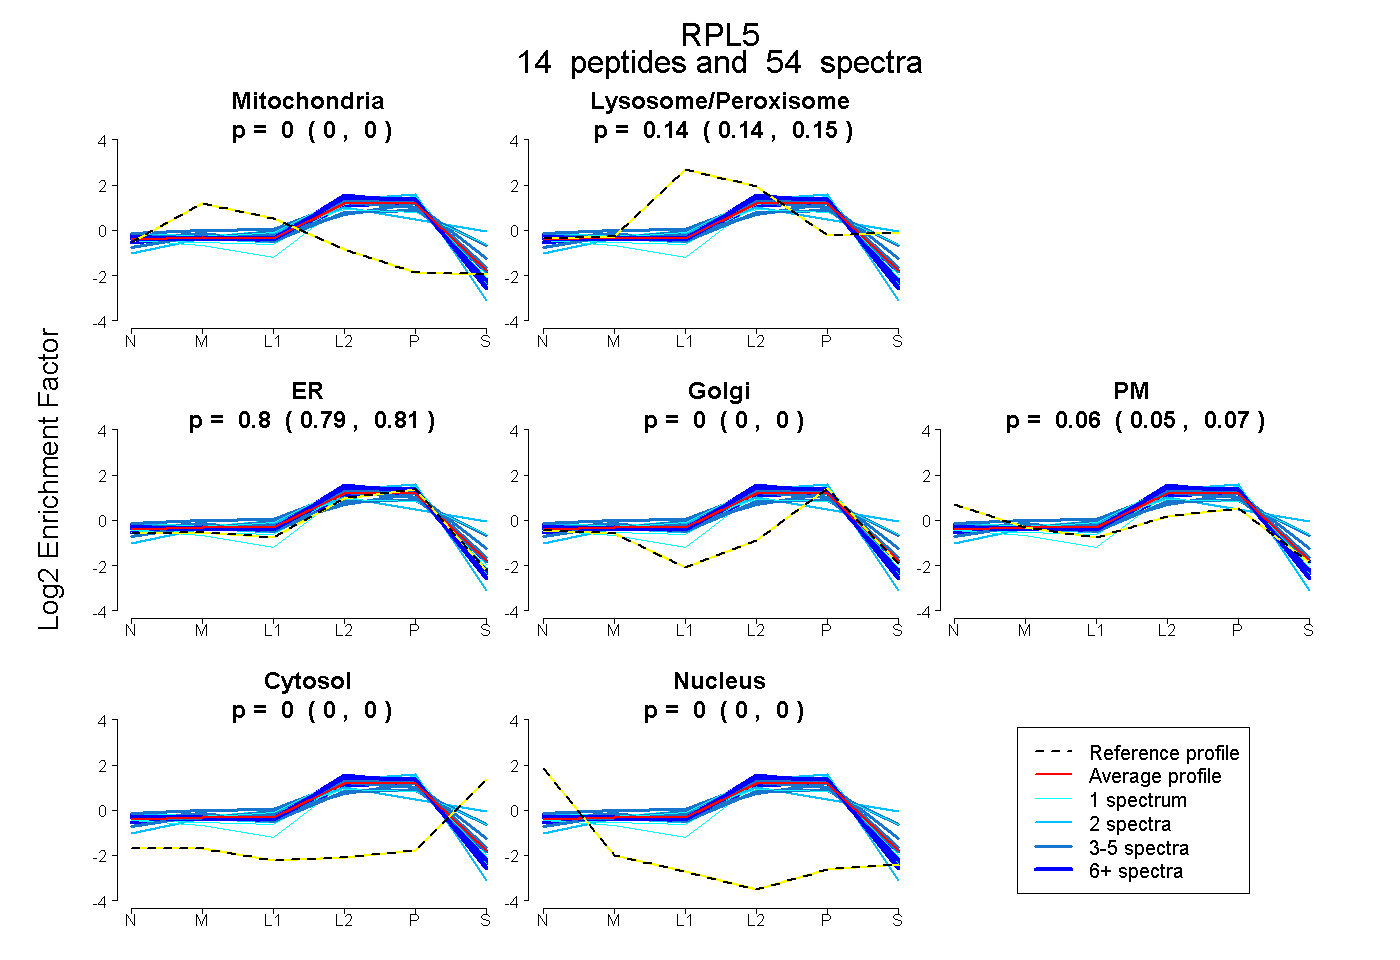
0.000 | 0.000
0.137 | 0.150
0.786 | 0.811
0.000 | 0.000
0.045 | 0.066
0.000 | 0.000
0.000 | 0.000
16peptides
spectra
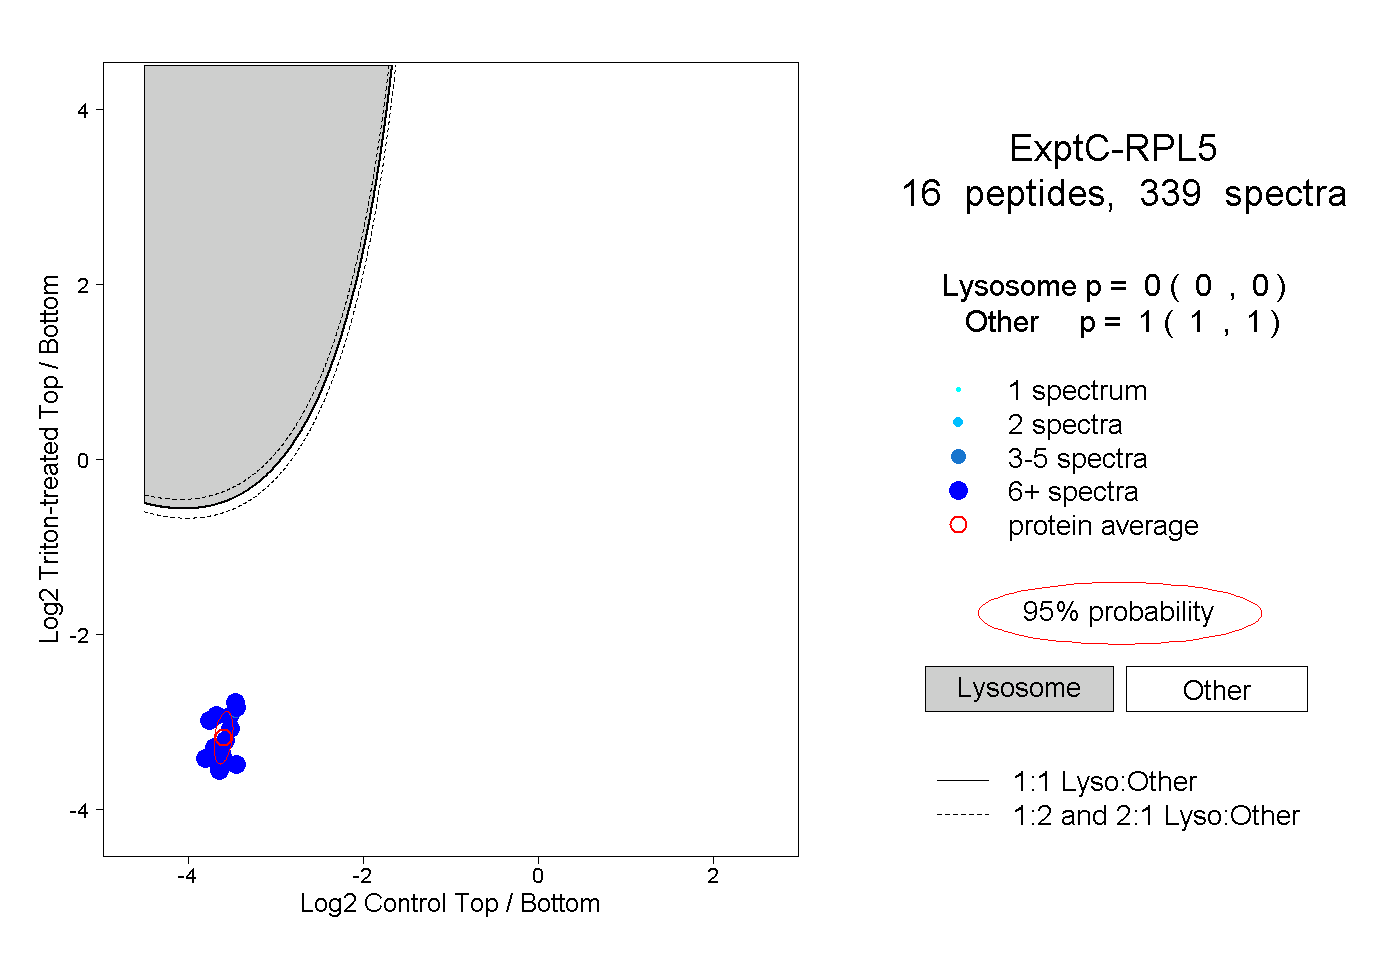
0.000 | 0.000
1.000 | 1.000
9peptides
spectra
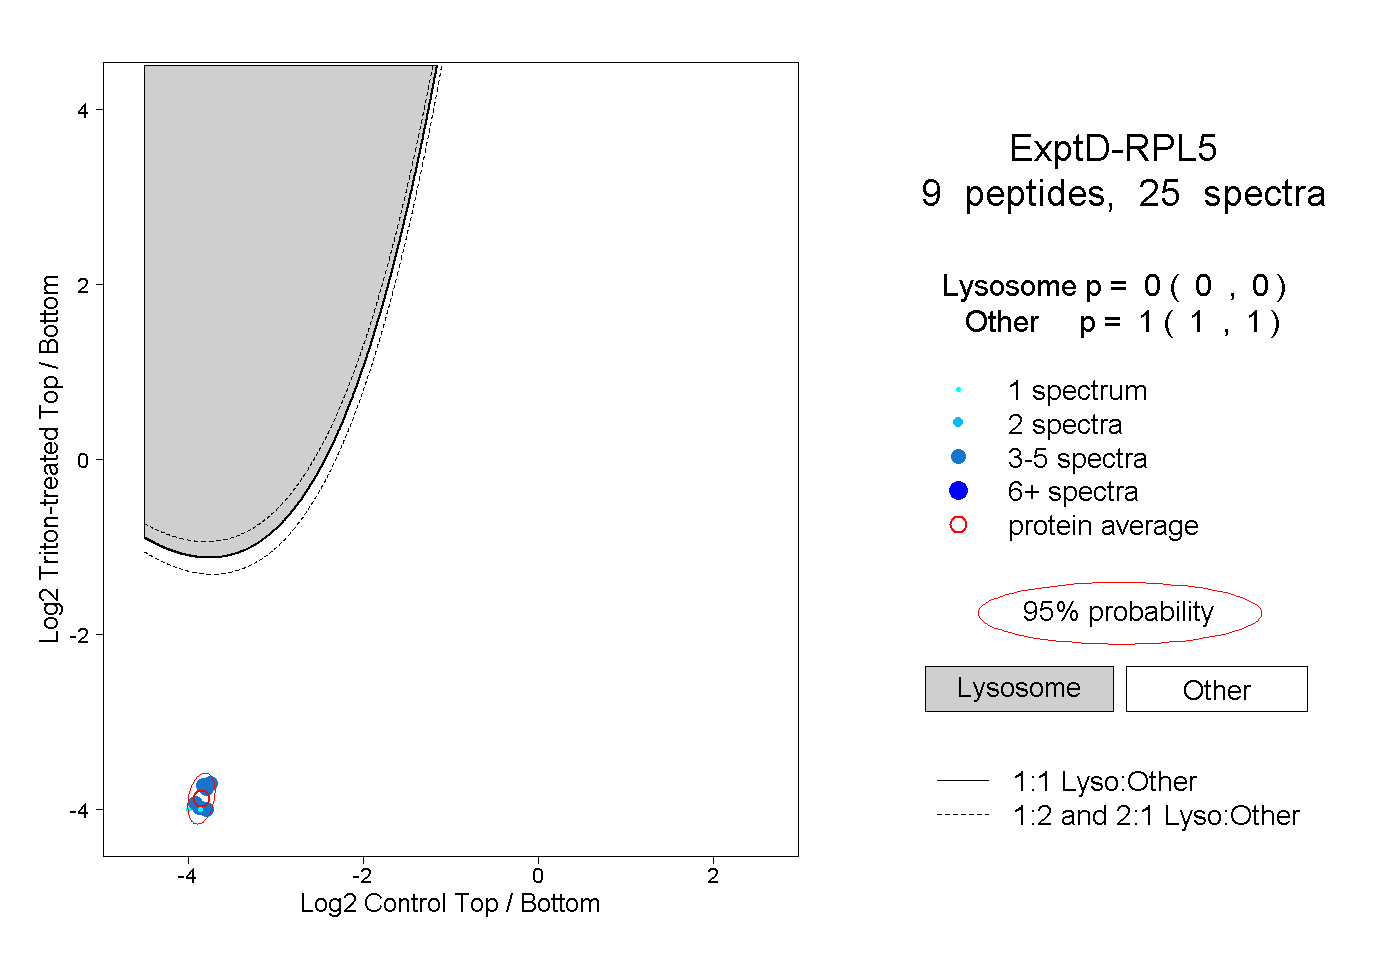
0.000 | 0.000
1.000 | 1.000